大地测量观测数据可视化MATLAB工具箱:(1)时间序列、统计数据可视化
将相同时间间隔内的(相似的)信号堆叠到一个图形中,但复制和移位了x轴。所有子图形都使用相同的标签,不同的图形通过将背景从白色切换到灰色,然后再切换回白色来在视觉上分开。这种可视化增加了非常相似信号的可读性,特别推荐在没有彩色印刷的文章中表示/比较数据。,这里介绍的这个函数可以等间隔绘制阴影,或者不等间隔。(2)时间序列添加阴影。(1)三维柱状图渲染。
·
大地测量的各类观测结果需要进行可视化才能更好应用了后续的分析和解释,这里我分享德国斯图加特大学大地测量研究所的一个工具包(VISBUNDLE)。
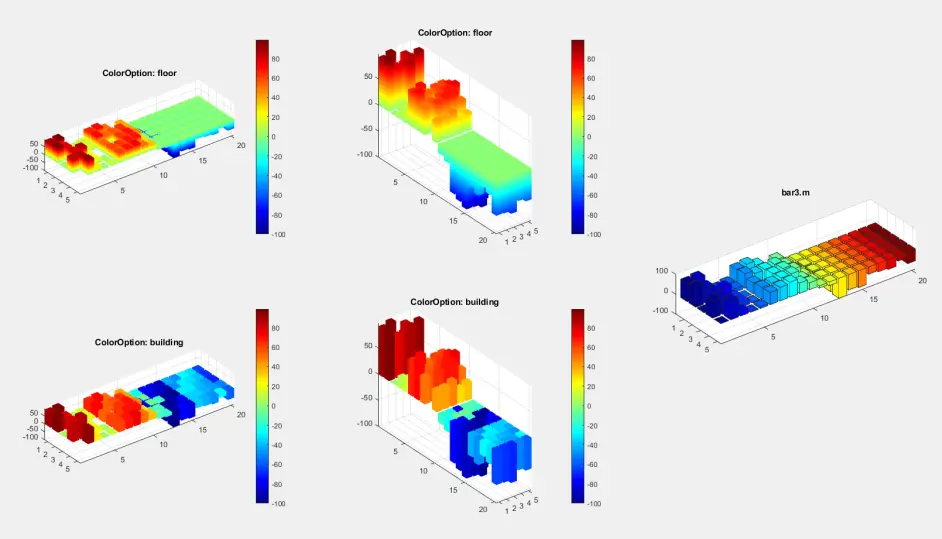
(1)三维柱状图渲染
H = magic(10);
H = [H(1:5,:), -H(6:10,:)];
H(3,5) = NaN; H(3,7) = Inf;
H(5,1) = -Inf;H(1,9) = 0;
figure
subplot(231);barplotcol(H,'floor'); title('ColorOption: floor')
subplot(232);barplotcol(H','floor'); title('ColorOption: floor')
subplot(234);barplotcol(H,'building'); title('ColorOption: building')
subplot(235);barplotcol(H','building'); title('ColorOption: building')
subplot(2,3,[3,6]); bar3(H); title('bar3.m'),colormap jet
barplotco.m函数:
function handle = barplotcol(H,ColorOption,maxRowCol)
% handle = barplotcol(H,ColorOption,maxRowCol)
% handle = barplotcol(H)
%
% BARPLOTCOL visualizes a data matrix as a "3D city block". The basic idea is
% the routine bar3.m, but the color is refering to the height information
% instead of the column of the matrix. Inf and NaN elmenents are replaced by
% zero before visualization.
%
% IN:
% H: ............ 2-dimensional data matrix                                  [-][NxM]
% ColorOption:... choice between                                                ['string']
%                  * 'floor': colored layers indicated the same height
%                  * 'building': color indicates the value in the marix
% maxRowCol:..... option to increase the maximal number of columns and rows  [-][1x1]
%                 default: no plot for more than 10000 elements
%
% OUT:
% handle:........ handle of the graphics for further improvement
%
% See also: --
%
% sub-routines:
%    *   --
%
% REMARKS:
%    *   The size of the matrix is limited by the bar3.m function.
%    *   For more than 10000 elements, the bar-routine is very slow and you
%        get an warning now. If you really want more, increase the limit by
%        the additional input of 'maxRowCol'.
%

% -------------------------------------------------------------------------
% project: visBundle
% -------------------------------------------------------------------------
% authors:
%    Markus ANTONI (MA), GI, Uni Stuttgart
% -------------------------------------------------------------------------
% revision history:
%    2021-05-04: MA, unified help text in VISBUNDLE
%    2013-02-20: MA, renamed for visBundle
%    2013-02-12: MR, prushed up of help text
%    2010-10-21: MA, initial version at DEOS
% -------------------------------------------------------------------------
% license:
%    This program is free software; you can redistribute it and/or modify
%    it under the terms of the GNU General Public License as published by
%    the  Free  Software  Foundation; either version 3 of the License, or
%    (at your option) any later version.
%
%    This  program is distributed in the hope that it will be useful, but
%    WITHOUT   ANY   WARRANTY;  without  even  the  implied  warranty  of
%    MERCHANTABILITY  or  FITNESS  FOR  A  PARTICULAR  PURPOSE.  See  the
%    GNU General Public License for more details.
%
%    You  should  have  received a copy of the GNU General Public License
%    along with Octave; see the file COPYING.
%    If not, see <http://www.gnu.org/licenses/>.
% -------------------------------------------------------------------------


%% checking the input arguments
narginchk(1,3)
if nargin<2
    ColorOption = 'building';
end
if nargin<3
    maxRowCol = 10000;
end

% number of elements
[row,column] = size(H);
if row*column>maxRowCol
    warning('amount of elements is quite large for bar3, increase >> maxRowCol << if you really want this')
    return
end

%% removing NaN/Inf
index    = isnan(H);
H(index) = 0;
index    = isinf(H);
H(index) = 0;


% basic is the function BAR3
handle = bar3(H,'detached');
row6   = row*6;
set(handle,'FaceAlpha',1);
set(gcf, 'Renderer', 'ZBuffer');


switch ColorOption
case 'building'
    % constant color per block
    for n=1:column
        index = logical(kron(H(:,n) == 0,ones(6,1)));
        colorData = get(handle(n),'ZData');
        colorData(index,:) = nan;
        % changing the color of all 6 faces per block
        for k = 1:6:row6;
            colordata1 = colorData(k:k+5,:);
            index1     = colordata1 == 0;
            colordata1(index1) = colordata1(2,2);

            colorData(k:k+5,:) = colordata1;
        end
        set(handle(n),'cData',colorData);
    end
case 'floor'
    % equal color for equal height layer
    for n=1:column
        index     = logical(kron(H(:,n) == 0,ones(6,1)));
        colorData = get(handle(n),'ZData');
        colorData(index,:) = nan;
        set(handle(n),'cData',colorData);
    end
otherwise
    warning('chosen ''ColorOption'' is not implemented')
end


shading interp; axis tight;
colorbar
结果图
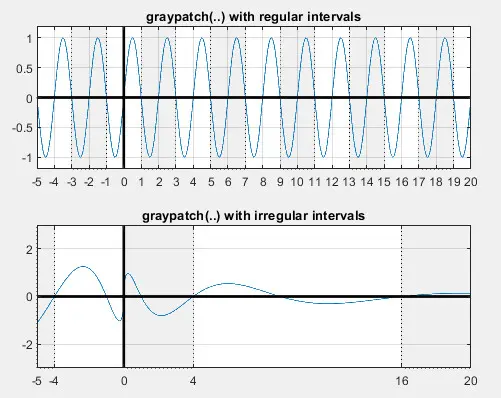
(2)时间序列添加阴影
我之前介绍过一个添加阴影的函数,这里介绍的这个函数可以等间隔绘制阴影,或者不等间隔。
figure;
subplot(211);
t = -5:.01:20;
f1 = sin(t*pi);
plot(t, f1); hold on;
graypatch([-5,2,20], [-1.2,1.2], [-5:1:20],true);
title('graypatch(..) with regular intervals');

subplot(212);
f2 = sin(sign(t).*sqrt(abs(t))*pi).*exp(-t/10);
plot(t,f2); hold on;
xStartEnd = [-5,-4;0,4; 16,20];
graypatch(xStartEnd,[-3,3],[-5 -4 0 4 16 20]);
title('graypatch(..) with irregular intervals');
graypatch.m函数:
function h = graypatch(xStartEnd, Ylim, Xtick,white1)
% h = graypatch(xStartEnd, Ylim, Xtick,white1)
%
% GRAYPATCH hightlights 'periodic' events by marking every second period
% with an alternating white/gray backgroud. Graypatch can also deal with
% non-equal time spans (see example).
%
% IN:
%   xStartEnd .. defines the time points of the events,
%                [start, period_increment, end] for regular spacing             [1x3]
%                [T0, T1; T2, T3; ...] for irregular spacing                    [Nx2]
%   Ylim ....... limits of y-axis                                               [1x2]
%   Xtick ...... labels on the x-axis (e.g. periods T*n)                        [1xN]
%   white1...... first patch is white for white1 = true (default) or            [1x1]
%                gray for white1 = false
%
% OUT:
%  h:............ handle of the graphics for further improvement
%
% REMARKS:
%    *   To avoid "hidden yticks", is recommanded to start with a white patch
%        which is the default in the new version
%

% -------------------------------------------------------------------------
% project: visBundle
% -------------------------------------------------------------------------
% authors:
%    Markus ANTONI (MA), GI, Uni Stuttgart
%    Matthias ROTH (MR), GI, Uni Stuttgart
% -------------------------------------------------------------------------
% revision history:
%    2021-05-04: MA, start with white patch to avoid hidden yticks
%    2016-03-14: MR, brush-up help text; remove alpha bug: plotted gray
%                    bars on top of the data, hence changing their color;
%                    change code, that also fractions of periods are
%                    possible
%    2015-03-17: MA, some modifications
%    2015-02-19: MA, initial version, based on gray_patch of
%                    Mohammad J. TOURIAN
% -------------------------------------------------------------------------
% license:
%    This program is free software; you can redistribute it and/or modify
%    it under the terms of the GNU General Public License as published by
%    the  Free  Software  Foundation; either version 3 of the License, or
%    (at your option) any later version.
%
%    This  program is distributed in the hope that it will be useful, but
%    WITHOUT   ANY   WARRANTY;  without  even  the  implied  warranty  of
%    MERCHANTABILITY  or  FITNESS  FOR  A  PARTICULAR  PURPOSE.  See  the
%    GNU General Public License for more details.
%
%    You  should  have  received a copy of the GNU General Public License
%    along with Octave; see the file COPYING.
%    If not, see <http://www.gnu.org/licenses/>.
% -------------------------------------------------------------------------

%% checking the input arguments
narginchk(2,4)
if nargin < 4,   white1 = true;   end
if nargin < 3,   Xtick = [];      end

if ~isscalar(white1), error('argument ''white1'' must be scalar'); end
if ~islogical(white1), error('argument ''white1'' must be boolian'); end
if isscalar(Xtick) && islogical(Xtick), white1 = Xtick; end

%% create Start-End matrix from [start, period_increment, end]
if numel(xStartEnd) == 3
    V(1, :) = xStartEnd(1)+white1*xStartEnd(2):(2*xStartEnd(2)):xStartEnd(3);
    V(2, :) = V(1, :) + xStartEnd(2);
    V(V > xStartEnd(3)) = xStartEnd(3);
else % we expect non-periodic elements
    V      = xStartEnd';

end
blocks = numel(V(1, :));
if blocks < 2
    warning('graypatch requires more than 1 patch');
    return
end


%% prepate patch coordinates
X = V([1; 1; 2; 2], 1:blocks);
Y = repmat(Ylim([1, 2, 2, 1])', 1, blocks);
Z = ones(size(X));

%% gray blocks
h = patch(X, Y, Z, 'facecolor', [0.94 0.94 0.94], 'LineStyle', ':'); hold on;
try
    uistack(h, 'bottom');     % put gray blocks on lowest graphics layer
catch
    warning('''uistack''-routine is missing, gray blocks are not in lowest layer now')
end
grid off;

%% labeling, grid
Xlim = [min(V(:)),max(V(:))];
if nargin > 2
    if isvector(Xtick) == 1 && numel(Xtick) > 1
        set(gca, 'xtick', unique(Xtick))
        Xlim = [min(Xtick), max(Xtick)];
        xlim(Xlim);
    else
        if islogical(Xtick) == false
            error('''Xtick'' must be given as a vector in increasing order')
        end
    end
end

%% add x- and y-axis
if prod(Ylim) < 0
    plot(Xlim, [0,0], 'k', 'LineWidth', 2)
end
if prod(Xlim) < 0
    plot([0, 0], Ylim, 'k', 'LineWidth', 2)
end
ylim(Ylim);
grid on;

try
    % improvement of axes, maybe only for new versions of MATLAB?
    ax = gca;
    ax.Layer = 'top';
catch
    warning('ax.Layer = ''top'' does not work in your enviroment, axes are not in top layer now')
end
结果图:
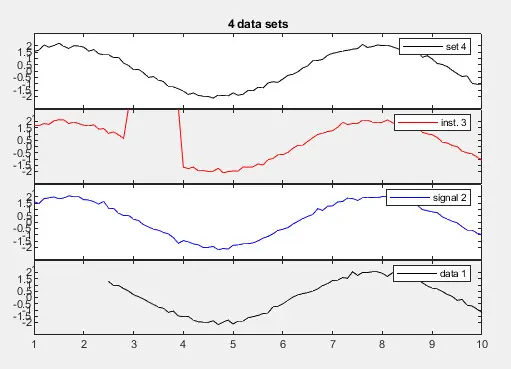
(3)图形堆叠绘制
将相同时间间隔内的(相似的)信号堆叠到一个图形中,但复制和移位了x轴。所有子图形都使用相同的标签,不同的图形通过将背景从白色切换到灰色,然后再切换回白色来在视觉上分开。这种可视化增加了非常相似信号的可读性,特别推荐在没有彩色印刷的文章中表示/比较数据。
t = 1:.1:10; y = bsxfun(@plus,2*sin(t),randn(4,numel(t))/10);
y(3,20:30) = 3.1; y(1,1:15) = NaN
legendcell = {'data 1','signal 2','inst. 3','set 4'}
figure; plotmulti(t, y ,legendcell);
figure; plotmulti(t,y,legendcell,[-3,3],[-2:.5:2],[0:1:10],'4 data sets',{'k','r','b'});
plotmulti.m函数:
function handle = plotmulti(time, data,legendcell, ylimits, yticks, xticks,titleStr,color)
% handle = plotmulti(time, data,legendcell, ylimits, yticks, xticks,titleStr,color)
%
% PLOTMULTI visualizes several one-dimensional data sets within the same time
% interval in one figure and with repeated y-axes. A possible application is the
% comparison of several instruments in one location.
%
% For readablitity, only 12 data sets are allowed.
%
% IN:
% time: ..........argument/time                                                 [Nx1]
% data:.........  data set/observations                                         [NxM]
% legendcell ...  legend per data set as a cell                           {cell}[Mx1]
% ylimits:......  maximum/minimum of y-axis (equal for all sets)                [2x1]
% yticks:.......  labels of y-axis                                              [nx1]
% xticks:.......  labels of x-axis                                              [mx1]
% titleStr:.....  title of the complete figure                             ['string']
% color:........  set the color, e.g. color = {'r','b'} for red/blue signals   [cell]
%
% OUT:
% handle:........ handle of the graphics for further improvement
%
% See also: GRAYPATCH
%
% sub-routines:
%    *   --
%
% REMARKS:
%    *   The function uses the command SUBPLOT already. The application of
%        PLOTMULTI within another subplot might cause unexpected behaviour.
%    *   If the vector COLOR has less entries, than the DATA matrix, then
%        color will be repeat
%
% -------------------------------------------------------------------------
% project: visBundle
% -------------------------------------------------------------------------
% authors:
%    Markus ANTONI (MA), GI, Uni Stuttgart
% -------------------------------------------------------------------------
% revision history:
%    2021-05-04: MA, new order of input & legend per data set is required
%                    unified help text in VISBUNDLE
%    2018-01-29: MA, integration into VISBUNDLE
%    2018-01-24: MA, initial version
% -------------------------------------------------------------------------
% license:
%    This program is free software; you can redistribute it and/or modify
%    it under the terms of the GNU General Public License as published by
%    the  Free  Software  Foundation; either version 3 of the License, or
%    (at your option) any later version.
%
%    This  program is distributed in the hope that it will be useful, but
%    WITHOUT   ANY   WARRANTY;  without  even  the  implied  warranty  of
%    MERCHANTABILITY  or  FITNESS  FOR  A  PARTICULAR  PURPOSE.  See  the
%    GNU General Public License for more details.
%
%    You  should  have  received a copy of the GNU General Public License
%    along with Octave; see the file COPYING.
%    If not, see <http://www.gnu.org/licenses/>.
% -------------------------------------------------------------------------

%% checking argument 1,2,3
narginchk(3,8)
if ~ismatrix(data), error('''data'' must be a matrix'); end
if ~isvector(time), error('''time'' must be a vector'); end
if ~iscell(legendcell)
    warning('order of arguments is changed now, please check help text')
    error('''legendcell'' must be a cell array');
end

%% default settings for argument 4...8
if nargin < 6, warning('''PLOTMULTI'': arguments 4,5 and 6 will improve the Figure'); end
if nargin < 4, ylimits =  1.2*([min(data(:)), max(data(:))]);   end
if nargin < 5, yticks  =  ([min(data(:)), max(data(:))]);   end
if nargin < 6, xticks  =  time(1:20:end);   end
if nargin < 7, titleStr = 'Multiple data sets';   end
if nargin < 8, color = {'k'};      end

if ~iscell(color)
    color = {'r','b','k','g','r:','b:','k:','g:'};
end
if ~ischar(titleStr)
    titleStr = 'Multiple data sets';
end

% dimension of time and data
time = time(:);
time_anz = numel(time);
[row,col] = size(data);
if ismember(time_anz, [row,col]) == 0
    error('data set must have the same length as ''time''')
end
if row ~= time_anz
    data = data';
    col = row;
end
if col > 12
    error('The figures will be too small. Please split the data set')
end
try
    legendcell{col};
catch
    error('''legendcell'' has not enough entries')
end

%% checking limits and labels
switch numel(ylimits)
case 2
    % everything ok
case 1
    ylimits = [-ylimits,ylimits];
otherwise
    error('interval ''ylimits'' must be a vector [2x1]')
end
xlimits = [min(time),max(time)];
if isvector(xticks) == false && numel(xticks) == 1
    error('argument ''xticks'' must be a vector')
end
if isvector(yticks) == false
    error('argument ''yticks'' must be a vector')
end
xticks  = unique(xticks);
yticks  = unique(yticks);
xtickrm = xticks(2:end-1);

%% plot several overlapping subplots
height = 0.9/(col+1);
iter = 1;
iterMax = length(color);
for ii = col:-1:1
    subplot('Position',[0.1,ii*height,0.8,height])
    handle(ii) = plot(time,data(:,ii),color{iter});
    ylim(ylimits)
    xlim(xlimits)
    set(gca,'YTick',yticks)

    % x-ticks for all, and for the lowest figure:
    if ii > 1
        set(gca,'XTick',xtickrm)
    else
        set(gca,'XTick',xticks)
    end
    if ii == col
        title(titleStr)
    end

    % try the given legends ...
    try
        legend(legendcell{ii} )
    catch
    end

    % gray patches for every 2nd subplot
    if rem(ii,2) == 1
        set(gca,'Color',[0.94 0.94 0.94])
    end

    % if less colors then data are given, the color repeats:
    iter = iter+1;
    if iter > iterMax
        iter = 1;
    end
end
结果图:
参考资料:
(1)https://www.gis.uni-stuttgart.de/en/research/downloads/visbundle/
(2)The toolbox VISBUNDLE (version #/date #) was developed by N. Sneeuw, M. Weigelt,M. Roth, M. Antoni, M. Tourian et. al. and its latest version is provided via download from the Institute of Geodesy (GIS), University of Stuttgart
魔乐社区(Modelers.cn) 是一个中立、公益的人工智能社区,提供人工智能工具、模型、数据的托管、展示与应用协同服务,为人工智能开发及爱好者搭建开放的学习交流平台。社区通过理事会方式运作,由全产业链共同建设、共同运营、共同享有,推动国产AI生态繁荣发展。
更多推荐


 2
2 0
0- 0


 已为社区贡献7条内容

所有评论(0)