数据可视化 - 矩阵 - Matplot
文章目录R语言可视化一、矩阵1.矩阵的定义1.1 matrix( )1.2 rbind( )1.3 cbind( )2.矩阵的操作2.1 矩阵取值2.2 判断是否为矩阵2.3 矩阵的命名2.4 t( ) 矩阵转置二、绘图-Matrix-Matplot1.matplot( )2.legend3.axis( )4.定义绘图函数function三、Data Frame1.Data Frame的获取1.1
文章目录
R语言可视化
主要涉及矩阵、Data Frame、matplot( )、qplot( )、ggplot( )
提示:以下是本篇文章正文内容,下面案例可供参考
一、矩阵
1.矩阵的定义
1.1 matrix( )
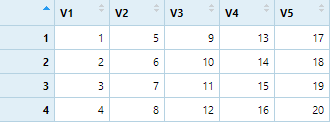
把vect1数组按 列 排成4X5的矩阵
vect1=c(1:20)
a=matrix(vect1,4,5)
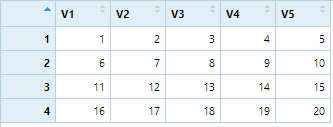
把vect1数组按 行 排成4X5的矩阵
vect1=c(1:20)
a=matrix(vect1,4,5,byrow=T)
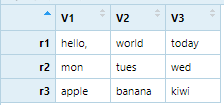
1.2 rbind( )
把 r1 , r2 , r3 分别排成三行
r1=c("hello,","world","today")
r2=c("mon","tues","wed")
r3=c("apple","banana","kiwi")
m1=rbind(r1,r2,r3)
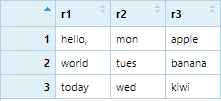
1.3 cbind( )
把 r1 , r2 , r3 分别排成三列
r1=c("hello,","world","today")
r2=c("mon","tues","wed")
r3=c("apple","banana","kiwi")
m2=cbind(r1,r2,r3)
2.矩阵的操作
2.1 矩阵取值
# 取第二行第二列数据
a[2,2]
# 取第三行第五列的数据
a[3,5]
# 取第二行所有数据
a[2,]
# 取第四列所有数据
a[,4]
# 取第一行和第二行的所有列
a[1:2,]
# 取行2-3,列3-4的所有数据
a[2:3,3:4]
# 取出了第1~5行的所有数据
a[1:5,,drop=F]
2.2 判断是否为矩阵
判断 m1 是否为矩阵
is.matrix(m1)
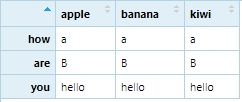
2.3 矩阵的命名
创建矩阵
lvex=c("a","B","hello","a","hello","a","B","hello")
#把 lvex 按列数据构成3X3矩阵
amat=matrix(lvex,3,3)
给矩阵的行命名
rownames(amat)=c("how","are","you")
给矩阵的列命名
colnames(amat)=c("apple","banana","kiwi")
输出are行,banana列的数据
amat["are","banana"]
取消命名
rownames(amat)=NULL
colnames(amat)=NULL
读取命名
#读取行名称
rownames(amat)
#读取列名称
colnames(amat)
2.4 t( ) 矩阵转置
讲矩阵 FieldGoals 的行列进行转置
tFieldGoals=t(FieldGoals)
二、绘图-Matrix-Matplot
# 矩阵 FieldGoals
FieldGoals
#把 FieldGoals 进行行列转置
tFieldGoals=t(FieldGoals)
# 绘图
matplot(tFieldGoals,type="b",pch=15:20,col=1:10,xlab = "Years",xaxt="n",ylab = "Goals")
# 设置图例
legend("bottomleft",legend = Players,pch=15:20,col=1:10,inset=0.01,horiz=F,cex = 0.8)
#x轴1-10的labels用Seasons表示
axis(1,1:10,labels = Seasons)
1.matplot( )
matplot(tFieldGoals,type="b",pch=15:20,col=1:10,xlab = "Years",xaxt="n",ylab = "Goals")
- matplot:将矩阵 tFieldGoals 的行做 x 轴,列做 y 轴进行绘图
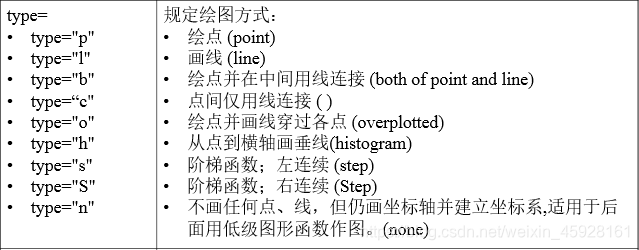
- type= :决定画的函数曲线的类型
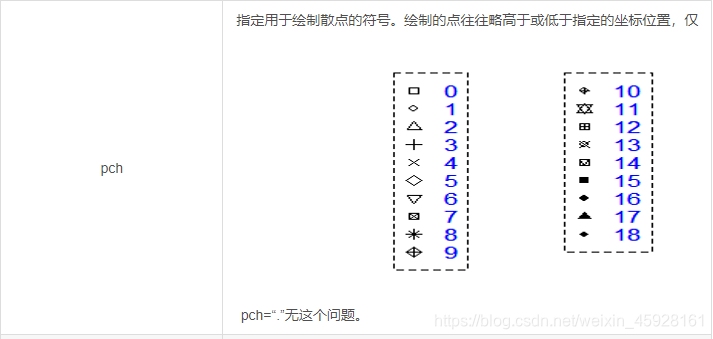
- pch= :决定绘制散点的类型
- col=:决定绘制函数图像的颜色

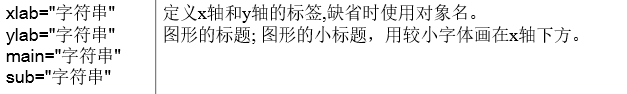
- xlab、ylab:x 轴、y 轴的标签
- xaxt=“n”:xaxt 和 yaxt 取”n”时,坐标轴、刻度线以及刻度值将不会画出。
matplot(tFieldGoals,type="b",pch=15:20,col=1:10,xlab = "Years",xaxt="n",ylab = "Goals")
type=“b”:绘制点,并用线连接点
pch=10:25:使用10~25,使用5种散点符号,分别表示各个函数曲线
col=1:10:使用1~10,使用10种颜色,分别绘制各个函数曲线
xaxt=“n”:x 轴的刻度线和刻度值不显示
2.legend
legend(x, y = NULL, legend, fill = NULL, col = par("col"),

        border = "black", lty, lwd, pch,

        angle = 45, density = NULL, bty = "o", bg = par("bg"),

        box.lwd = par("lwd"), box.lty = par("lty"), box.col = par("fg"),

        pt.bg = NA, cex = 1, pt.cex = cex, pt.lwd = lwd,

        xjust = 0, yjust = 1, x.intersp = 1, y.intersp = 1,

        adj = c(0, 0.5), text.width = NULL, text.col = par("col"),

        text.font = NULL, merge = do.lines && has.pch, trace = FALSE,

        plot = TRUE, ncol = 1, horiz = FALSE, title = NULL,

        inset = 0, xpd, title.col = text.col, title.adj = 0.5,

        seg.len = 2)
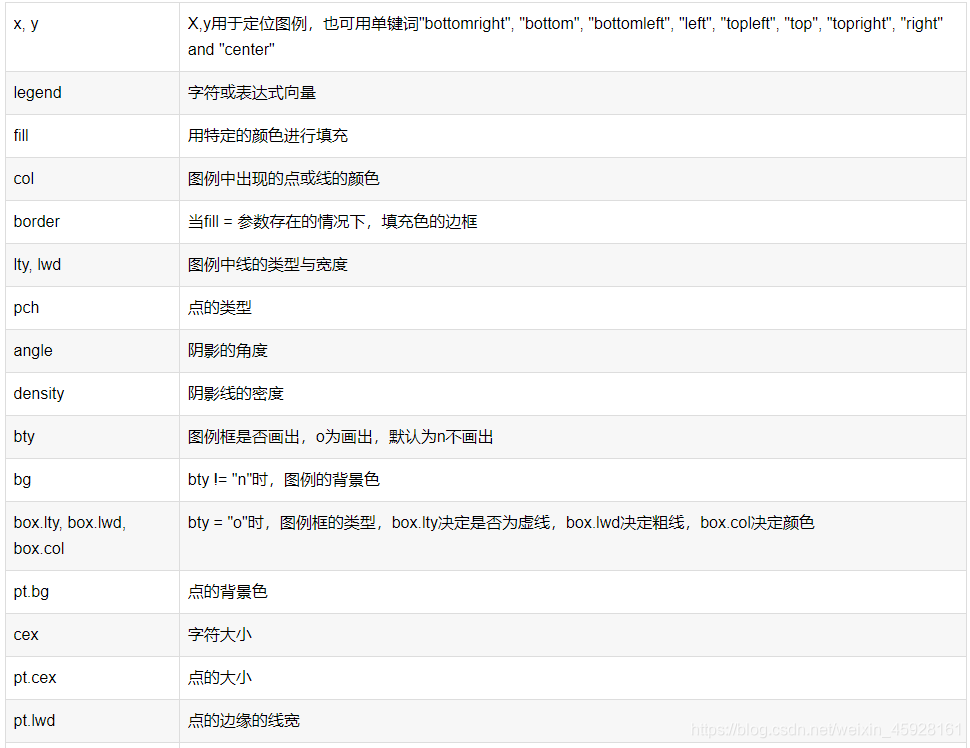
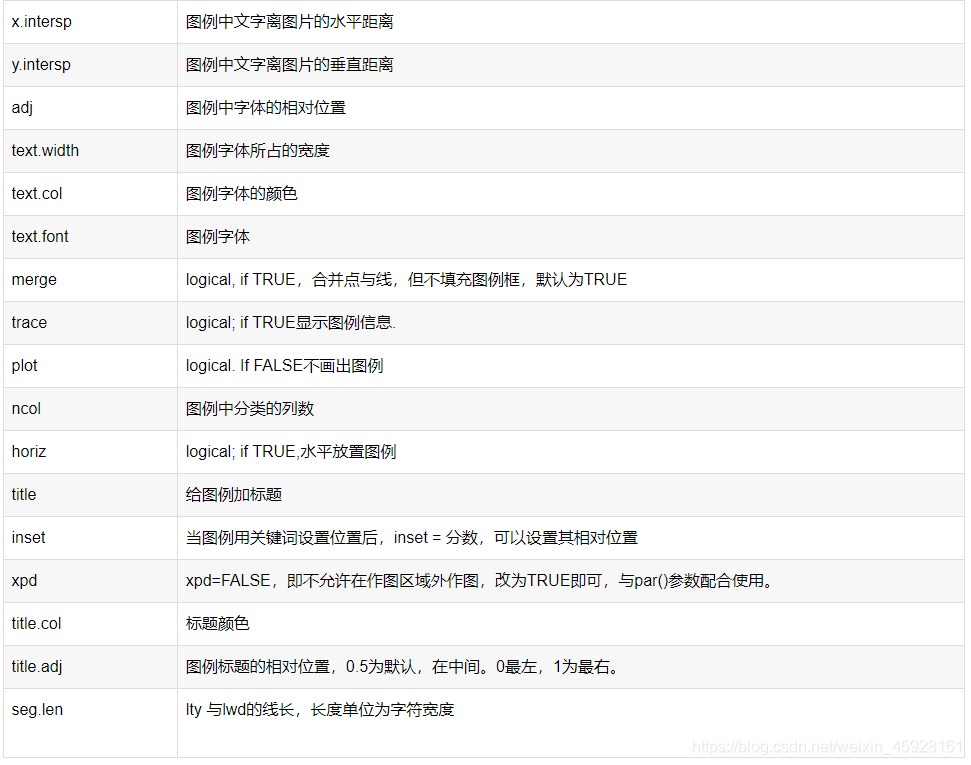
legend("bottomleft",legend = Players,pch=15:20,col=1:10,inset=0.01,horiz=F,cex = 0.8)
“bottomleft”:在图像左底角显示图例
legend = Players:图例的字符串是字符串数组Players
pch=15:20:点的类型用15~20,5种类型散点类型(是与matplot中的pch要对应)
col=1:10:曲线颜色用1~10,10种类型的图像颜色(是与matplot中的pch要对应)
inset=0.01:我们用了关键词 “bottomleft” 设置图例位置,可以用inset=分数,设置图例相对位置,这里0.01表示图例向左移动一点
horiz=F:图例竖直放置(TURE时水平放置)
cex = 0.8:设置字符大小为0.08
3.axis( )
axis(side, at = NULL, labels = TRUE, tick =TRUE,

     line = NA, pos = NA, outer = FALSE, font = NA,

     lty = "solid", lwd = 1, lwd.ticks = lwd,

     col = NULL, col.ticks = NULL,tck=, las=,...)
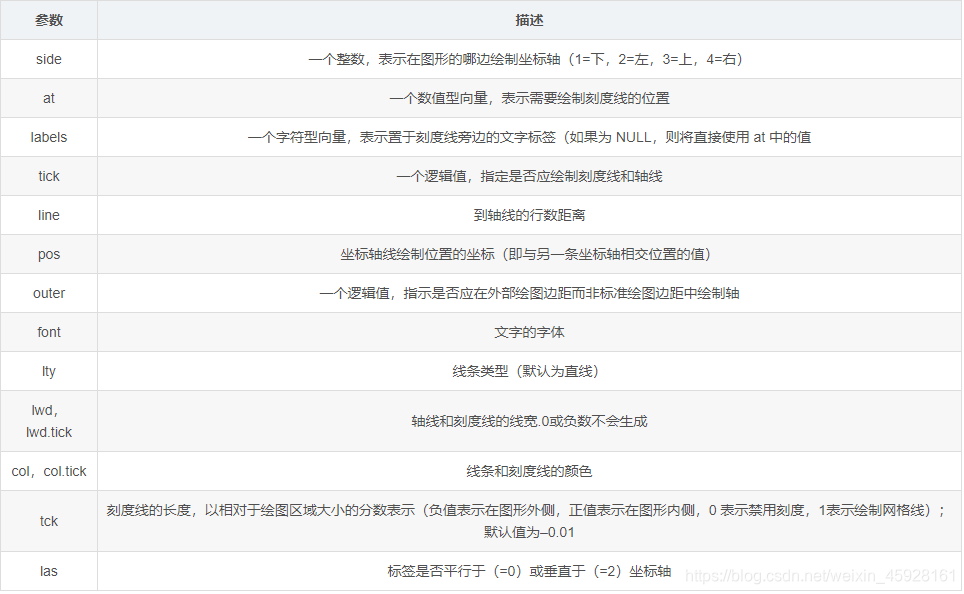
axis(1,1:10,labels = Seasons)
1:side=1,表示在图形下方绘制坐标轴
1:10:表示在坐标轴刻度值为1~10的十个位置做文字标签
labels = Seasons:表示我们的文字标签是Seasons字符串数组
4.定义绘图函数function
定义myplot函数,只需输入要绘制的矩阵,和绘制矩阵的对应行即可
myplot=function(mydata=Games,myrows=c(1:10)){#有一个初始化的值,可以让myplot()直接运行

  matplot(t(mydata[myrows,,drop=F]),type="b",pch = 1:10,col = 1:10,xaxt="n")

  legend("bottomleft",inset=0.01,legend=Players[myrows],pch = 1:10,col = 1:10)

  axis(1,1:10,labels=Seasons)

}
输入参数变量有两个初始值,如果对应参数变量没有输入,则使用初始值
Games:每个球员每年参见比赛的场次矩阵
c(1:10):默认矩阵的1~10行的数据
myplot()#默认画出1-10球员每年的出场次数图

myplot(Points,)#画出每年1-10球员的得分图

myplot(,c(1:2))#画出1-2球员每年出场次数

魔乐社区(Modelers.cn) 是一个中立、公益的人工智能社区,提供人工智能工具、模型、数据的托管、展示与应用协同服务,为人工智能开发及爱好者搭建开放的学习交流平台。社区通过理事会方式运作,由全产业链共同建设、共同运营、共同享有,推动国产AI生态繁荣发展。
更多推荐


 0
0 0
0- 0


 已为社区贡献1条内容

所有评论(0)