jquery用Echarts实现折线图
jquery用Echarts实现折线图
·
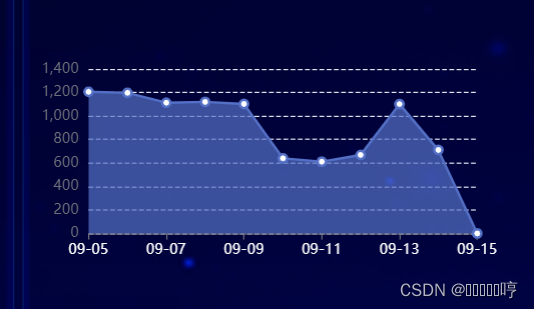
实现如下效果:

首先请求数据:
$.ajax({
    url: domainName + '/api/data-visualization/store/opinion/trend',
    type: 'post',
    data: {
        beginDate: beginDate,
        endDate: currentDate,
        keywords: '',
    },
    success(res) {
        if (res.code === 200) {
            console.log(res);
            initLineChart(res.data)
        }
    },
    error(err) {
        console.log(err);
    }
})
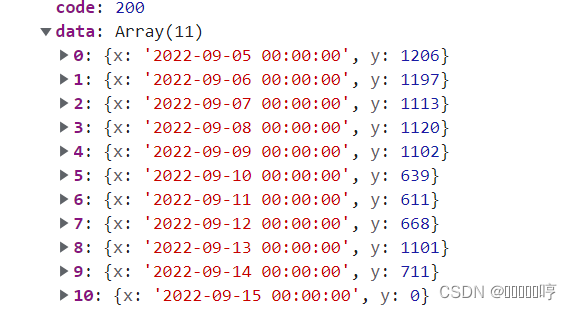
数据(x轴、y轴):

配置项:
const initLineChart = lineChartData => {
    console.log(lineChartData);
    console.log(lineChartData.map(i => i.x.substr(5, 5)));
    lineChart.setOption({
        // 提示框组件
        tooltip: {
            // 触发类型
            // 坐标轴触发,主要在柱状图,折线图等会使用类目轴的图表中使用
            trigger: 'axis',
            // 提示框浮层内容格式器
            // 折线(区域)图、柱状(条形)图、K线图 : {a}(系列名称),{b}(类目值),{c}(数值)
            formatter: '{b} <br />数据为:{c}',
            // 提示框浮层的文本样式
            textStyle: {
                fontSize: 12,
            }
        },
        // x轴
        xAxis: {
            // 坐标轴类型
            // 类目轴,适用于离散的类目数据
            type: 'category',
            // 坐标轴两边留白策略
            // true时,刻度只是作为分隔线,标签和数据点都会在两个刻度之间的带(band)中间
            boundaryGap: false,
            // 在类目轴(type: 'category')中有效
            data: lineChartData.map(i => i.x.substr(5, 5)),
            // 坐标轴刻度标签的相关设置
            axisLabel: {
                color: "#fff",
            },
        },
        // 坐标轴指示器(axisPointer)的全局公用设置
        axisPointer: {
            lineStyle: {
                color: '#666',
                type: 'solid'
            }
        },
        yAxis: {
            // 数值轴,适用于连续数据
            type: 'value',
            // 坐标轴在 grid 区域中的分隔线
            splitLine: {
                // 分隔线样式
                lineStyle: {
                    type: 'dashed'
                }
            },
        },
        series: [{
            itemStyle: {
                borderWidth: 5,
            },
            // 标记的大小
            symbolSize: 7,
            data: lineChartData.map(i => i.y),
            // 折线/面积图
            type: 'line',
            areaStyle: {}
        }]
    });
}
魔乐社区(Modelers.cn) 是一个中立、公益的人工智能社区,提供人工智能工具、模型、数据的托管、展示与应用协同服务,为人工智能开发及爱好者搭建开放的学习交流平台。社区通过理事会方式运作,由全产业链共同建设、共同运营、共同享有,推动国产AI生态繁荣发展。
更多推荐
 已为社区贡献2条内容


所有评论(0)