数据分析-电商用户购物行为分析
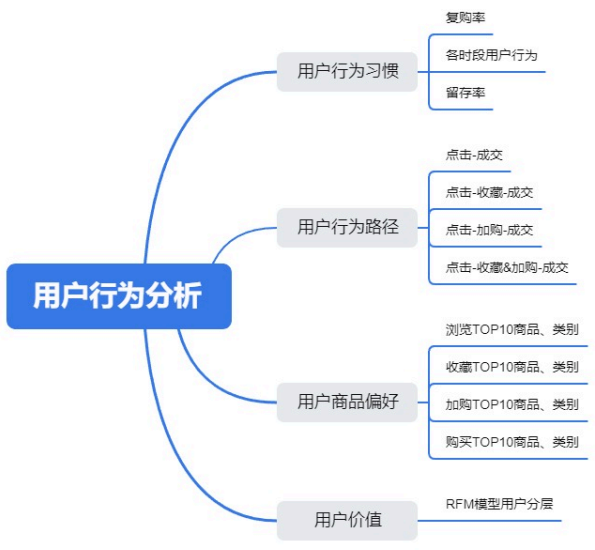
用户行为习惯、用户行为路径、用户商品偏好、用户价值、复购率、留存率、RFM
分析思路
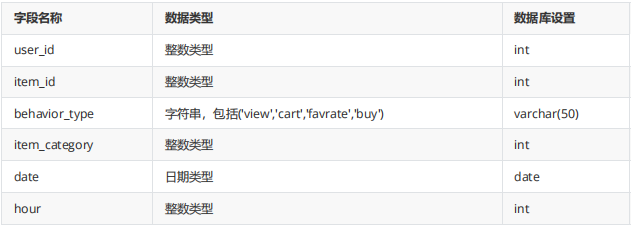
数据集说明
字段说明
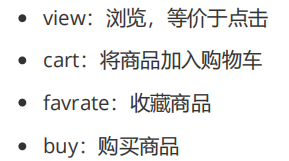
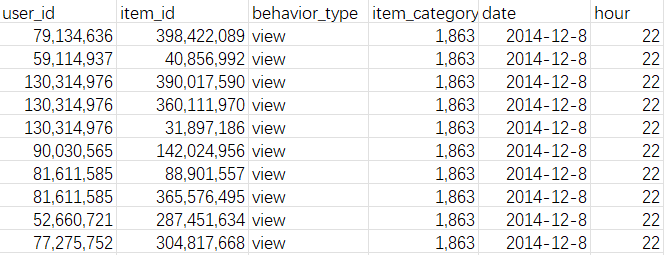
用户行为说明
数据处理与概览
数据去重
数据存储在CSV文件里,打开PowerBI导入文件,选中所有的列选择删除重复项,完成数据去重,删除第一列,将表格重命名为behavior。打开DAX Studio输入 EVALUATE 'behavior',导出处理好的文件,保存为CSV格式。
再将CSV导入Dbeaver,date的数据类型先选择vachar(50),导入成功后再将date的数据类型修改为date,否则日期会出错。
数据概览
-- 数据量有多少
select count(*) from behavior
-- 了解数据结构
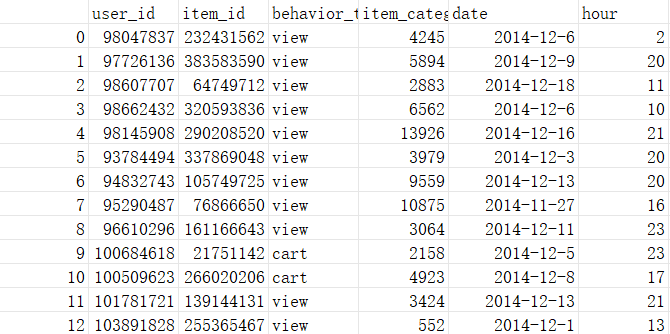
select * from behavior
limit 10
-- 有多少用户
select count(distinct user_id) from behavior
-- 查看空值
select
count(user_id),
count(item_id),
count(behavior_type),
count(item_category),
count(date),
count(hour)
from behavior
-- 查看异常值
select * from behavior
where
user_id < 0 or item_id < 0 or item_category <0 or date < 0
-- 看看有哪些用户行为
-- view浏览,cart将商品加入购物车,favrate收藏,buy购买商品
select
behavior_type,
count(*)
from behavior
group by behavior_type
-- 看一下时间范围
-- 从14年11月18日到12月18日,共有31天的数据
select
date,
count(user_id)
from behavior
group by date
order by date
-- 看下小时的具体情况
-- 原始数据是从0点开始计算的,到23点结束
select
hour,
count(user_id)
from behavior
group by hour
order by hour数据集中没有空值,也没有异常值。
数据分析
用户行为习惯
复购率
with ub
as
(
select
user_id,
sum(case when behavior_type ='view' then 1 else 0 end) as 点击数,
sum(case when behavior_type ='favrate' then 1 else 0 end) as 收藏数,
sum(case when behavior_type ='cart' then 1 else 0 end) as 加购数,
sum(case when behavior_type ='buy' then 1 else 0 end) as 成交数
from behavior
group by user_id
order by user_id
)
select
count(*) as 购买用户数,
sum(case when 成交数 >1 then 1 else 0 end) as 复购用户数,
sum(case when 成交数 >1 then 1 else 0 end)/count(*) as 复购率
from ub
where 成交数 > 0
-- 消费次数转化漏斗分析
with ub
as
(
select
user_id,
sum(case when behavior_type ='view' then 1 else 0 end) as 点击数,
sum(case when behavior_type ='favrate' then 1 else 0 end) as 收藏数,
sum(case when behavior_type ='cart' then 1 else 0 end) as 加购数,
sum(case when behavior_type ='buy' then 1 else 0 end) as 成交数
from behavior
group by user_id
order by user_id
)
select
count(*) as 用户数,
sum(case when 成交数 >=1 then 1 else 0 end) as '消费次数>=1',
sum(case when 成交数 >=2 then 1 else 0 end) as '消费次数>=2',
sum(case when 成交数 >=3 then 1 else 0 end) as '消费次数>=3',
sum(case when 成交数 >=4 then 1 else 0 end) as '消费次数>=4',
sum(case when 成交数 >=5 then 1 else 0 end) as '消费次数>=5'
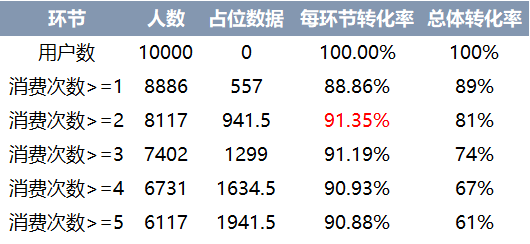
from ub运行代码得到各消费次数对应的人数,在Dbeaver选中结果右键选择高级复制-勾选标题和值就可以将结果复制到excel,每次只能复制200行,如果是数据量超过200行的要选择导出数据。
复制到excel再转置,结果为以下表格的前两列,占位数据是由用户数减去各消费次数再除以2得到的,每环节转化率是由各环节依次除以上一个环节的人数,总体转化率是各环节除以用户数。
数据可视化
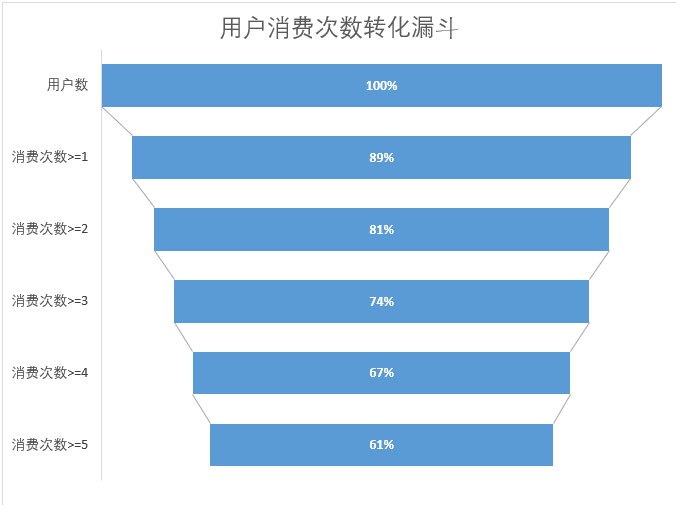
选择环节、人数和占位数据(不选中标题),插入堆积条形图,再调整细节就可以得到如下漏斗图。(具体步骤见excel数据可视化)
总结
用户复购率达到了91.35%,说明用户粘性以及忠诚度较高,购物体验基本符合用户心理预期,能够满足用户购物的需求。
基于消费次数的细分,可以更清楚了解转化情况,从而调整运营策略。
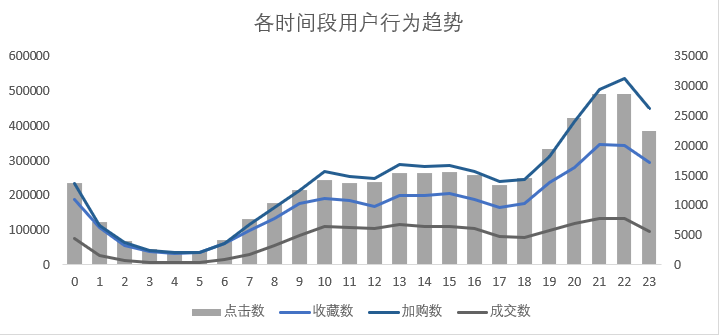
各时段用户行为
-- 按时间段看用户行为
-- 原始数据是从0点开始计算的,到23点结束
select
hour,
sum(case when behavior_type ='view' then 1 else 0 end) as 点击数,
sum(case when behavior_type ='favrate' then 1 else 0 end) as 收藏数,
sum(case when behavior_type ='cart' then 1 else 0 end) as 加购数,
sum(case when behavior_type ='buy' then 1 else 0 end) as 成交数
from behavior
group by hour
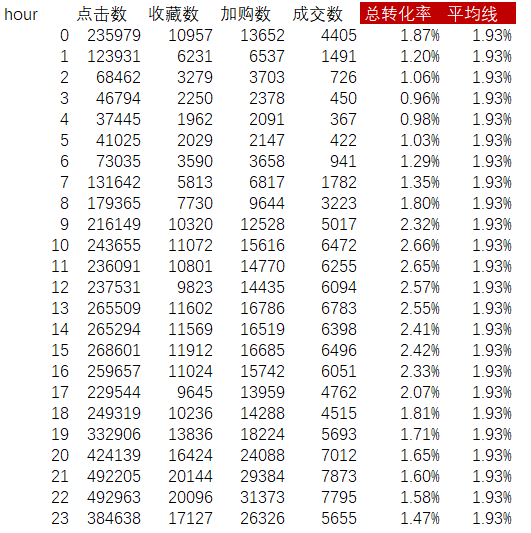
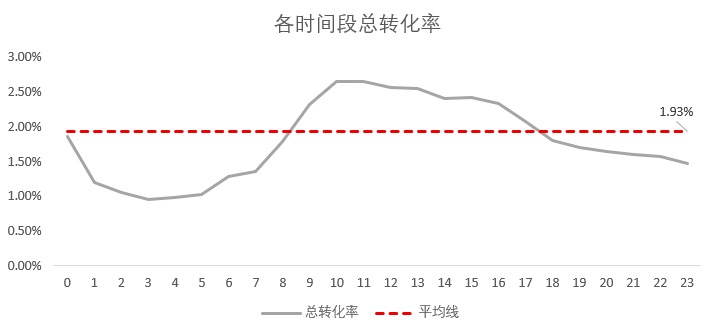
order by hour运行结果如下,总转化率是每个时段的点击数除以成交数,平均线是由各时段的点击数求和再除以各时段的成交数求和。
数据可视化
总结
从下午6点到晚上10点这段时间,是用户的活跃时间,商品的点击、加购、收藏均有所提升,不够从点击到购买的总体转换率相比上午9点到下午4点这段时间较低。
针对下午6点到晚上10点这一时间段,可进行一些促销类活动,提高购买人数,从而提高整体的转化率,进而提高总交易额。
留存率
-- 留存率分析
-- 2014/11/18到2014/12/12新增用户的次日留存率、3日留存率、7日留存率
-- 找出每个人最早出现的时间
with firstlogin as
(
select
t1.user_id,
min(date) as new_date
from behavior as t1
where date between '2014/11/18' and '2014/12/12'
group by t1.user_id
)
,
-- 计算每个用户登录日期与新增日期的日期差
t4 as
(
select
t2.user_id,
t2.new_date,
t3.date,
TimestampDiff(day,t2.new_date,t3.date) as day
from firstlogin as t2
left join
(select user_id,date from behavior group by user_id,date) as t3
on t2.user_id = t3.user_id
order by t2.user_id,t2.new_date,t3.date
)
-- 计算次日留存率、3日留存率、7日留存率
select
new_date,
count(if(day = 0,user_id,null)) as day0,
count(if(day = 1,user_id,null)) as day1,
count(if(day = 3,user_id,null)) as day3,
count(if(day = 7,user_id,null)) as day7,
count(if(day = 1,user_id,null))/count(if(day = 0,user_id,null)) as 次日留存率,
count(if(day = 3,user_id,null))/count(if(day = 0,user_id,null)) as 3日留存率,
count(if(day = 7,user_id,null))/count(if(day = 0,user_id,null)) as 7日留存率
from t4
group by new_date
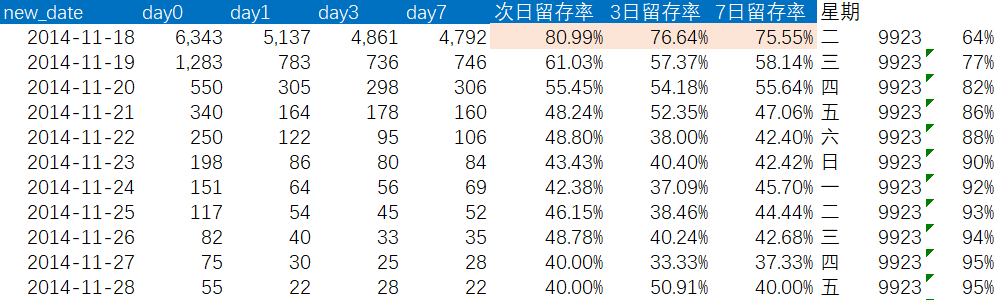
order by new_date部分结果如下,高亮显示的是大于平均留存率的值,9923是day0的总用户数,百分比是day0用户数累计占总用户数的比例。
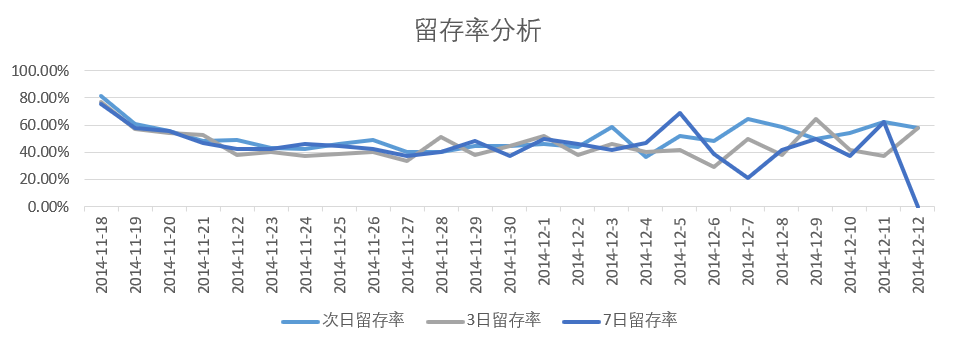
数据可视化
总结
2014/11/18~2014/12/12这段时间用户的新增主要集中于11/18~11/20这3天,累计达到82%,其中64%的用户在11/18新增;
2014/11/18~2014/12/12这段时间用户的次日、3日、7日留存率分别为71.00%、66.95%、66.62%;
2014/11/18该用户的次日、3日、7日留存率均值。
用户行为路径
转化路径
with ub
as
(
select
user_id,
sum(case when behavior_type ='view' then 1 else 0 end) as 点击数,
sum(case when behavior_type ='favrate' then 1 else 0 end) as 收藏数,
sum(case when behavior_type ='cart' then 1 else 0 end) as 加购数,
sum(case when behavior_type ='buy' then 1 else 0 end) as 成交数
from behavior
group by user_id
order by user_id
)
,
behavior_route
as
(
select
count(distinct user_id) as 总点击数,
count(distinct case when 收藏数=0 and 加购数=0 and 成交数>0 then user_id end) '点击-成交人
数',
count(distinct case when 收藏数=0 and 加购数=0 and 成交数>0 then user_id
end)/count(distinct user_id) as '点击-成交转化率',
count(distinct case when 收藏数>0 and 加购数=0 then user_id end) '点击-收藏人数',
count(distinct case when 收藏数>0 and 加购数=0 then user_id end)/count(distinct user_id)
as '点击-收藏转化率',
count(distinct case when 收藏数>0 and 加购数=0 and 成交数>0 then user_id end) as '点击-收藏-
成交人数',
count(distinct case when 收藏数>0 and 加购数=0 and 成交数>0 then user_id
end)/count(distinct user_id) as '点击-收藏-成交转化率',
count(distinct case when 收藏数=0 and 加购数>0 then user_id end) '点击-加购人数',
count(distinct case when 收藏数=0 and 加购数>0 then user_id end)/count(distinct user_id)
as '点击-加购转化率',
count(distinct case when 收藏数=0 and 加购数>0 and 成交数 >0 then user_id end) as '点击-加
购-成交人数',
count(distinct case when 收藏数=0 and 加购数>0 and 成交数 >0 then user_id
end)/count(distinct user_id) as '点击-加购-成交转化率',
count(distinct case when 收藏数>0 and 加购数>0 then user_id end) as '点击-收藏&加购人数',
count(distinct case when 收藏数>0 and 加购数>0 then user_id end)/count(distinct user_id)
as '点击-收藏&加购转化率',
count(distinct case when 收藏数>0 and 加购数>0 and 成交数>0 then user_id end) as '点击-收藏&
加购-成交人数',
count(distinct case when 收藏数>0 and 加购数>0 and 成交数>0 then user_id
end)/count(distinct user_id) as '点击-收藏&加购-成交转化率'
from ub
)
select '点击' as 路径, 总点击数 as 人数, null as 转化率 from behavior_route
union all
select '点击-成交' as 路径, `点击-成交人数` as 人数, `点击-成交转化率` as 转化率 from
behavior_route
union all
select '点击-收藏',`点击-收藏人数`,`点击-收藏转化率` from behavior_route
union all
select '点击-收藏-成交',`点击-收藏-成交人数`,`点击-收藏-成交转化率` from behavior_route
union all
select '点击-加购',`点击-加购人数`,`点击-加购转化率` from behavior_route
union all
select '点击-加购-成交',`点击-加购-成交人数`,`点击-加购-成交转化率` from behavior_route
union all
select '点击-收藏&加购',`点击-收藏&加购人数`,`点击-收藏&加购转化率` from behavior_route
union all
select '点击-收藏&加购-成交',`点击-收藏&加购-成交人数`,`点击-收藏&加购-成交转化率` from
behavior_route;
运行结果如下
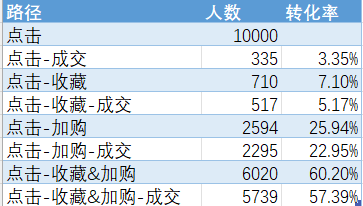
总结
从查询结果来看,用户路径为点击-收藏&加购-成交,其次是点击-加购-成交,用户行为路径存在加购行为的用户,两种路径加起来达到了80%,原因是加入购物车方便用户批量购买,可以通过运用活动引导用户对商品进行收藏及加购,进一步提高最终付费转化率。
对于点击-成交的这部分用户,可以对这部分用户的用户标签进行统计,初步形成该类商品对应的用户画像,在之后的活动对用于这类标签的用户优化商品推荐功能,精准推送商品信息。
用户商品偏好分析
with goods_record
as
(
select
`item_id`,
`item_category`,
sum(case when behavior_type ='view' then 1 else 0 end) as 点击数,
sum(case when behavior_type ='favrate' then 1 else 0 end) as 收藏数,
sum(case when behavior_type ='cart' then 1 else 0 end) as 加购数,
sum(case when behavior_type ='buy' then 1 else 0 end) as 成交数
from behavior
group by `item_category`,`item_id`
order by `item_category`,`item_id`
)
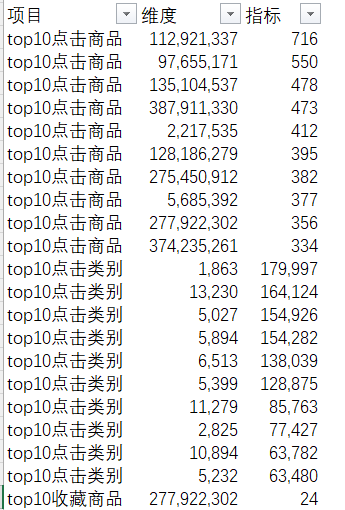
(select 'top10点击商品' as 项目,`item_id` as 维度,`点击数` as 指标 from goods_record order by `
点击数` desc limit 10)
union all
(select 'top10点击类别' as 项目, `item_category` as 维度, sum(`点击数`) as 指标 from
goods_record group by `item_category` order by sum(`点击数`) desc limit 10)
union all
(select 'top10收藏商品' as 项目,`item_id` as 维度,`收藏数` as 指标 from goods_record order by `
收藏数` desc limit 10)
union all
(select 'top10收藏类别' as 项目,`item_category` as 维度,sum(`收藏数`) as 指标 from goods_record
group by `item_category` order by sum(`收藏数`) desc limit 10)
union all
(select 'top10加购商品' as 项目,`item_id` as 维度,`加购数` as 指标 from goods_record order by `
加购数` desc limit 10)
union all
(select 'top10加购类别' as 项目, `item_category` as 维度, sum(`加购数`) as 指标 from
goods_record group by `item_category` order by sum(`加购数`) desc limit 10)
union all
(select 'top10成交商品' as 项目,`item_id` as 维度,`成交数` as 指标 from goods_record order by `
成交数` desc limit 10)
union all
(select 'top10成交类别' as 项目, `item_category` as 维度, sum(`成交数`) as 指标 from
goods_record group by `item_category` order by sum(`成交数`) desc limit 10)运行结果如下,分别统计了点击、收藏、加购、成交量前10的商品以及商品所属类别。
数据可视化
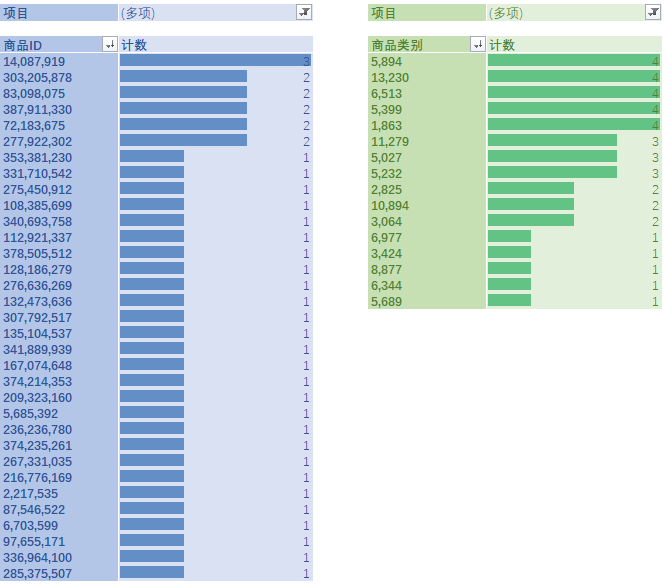
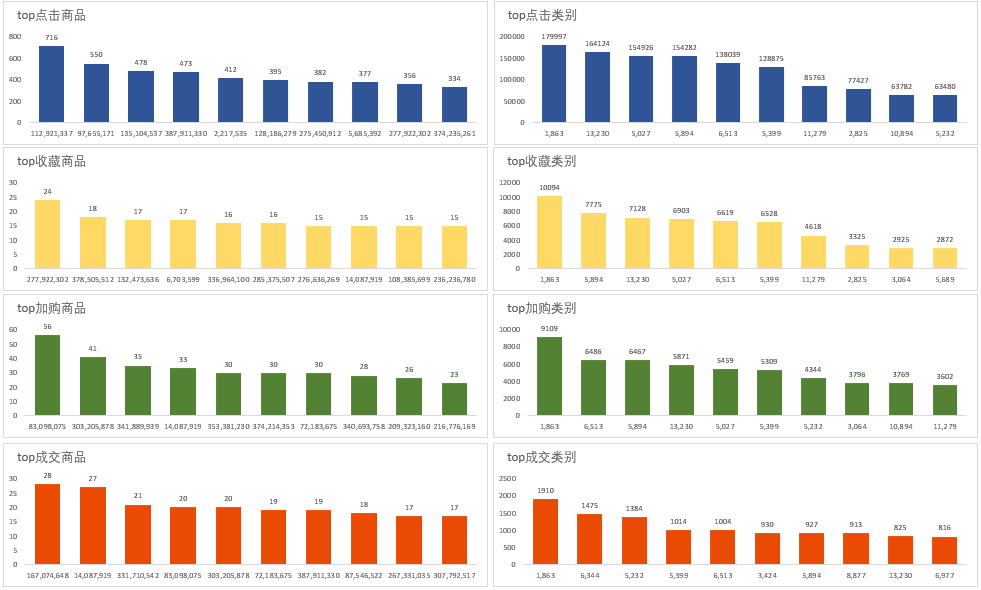
总结
对于多次出现的商品重点关注,可对热销商品加大曝光,优化热销商品种类展示,从而提高销量;
相同品类重合度高,说明商品推荐及商品检索的精准度能很好的满足用户需求。
用户价值
select rf AS
(
select
`user_id`,
TimestampDiff(day,max(date),'2014/12/18') AS r,
count(`user_id`) AS f
from behavior
where `behavior_type` = 'buy'
group by `user_id`
order by `user_id`
)
,
avgs
as
(
select avg(r) as avg_r,avg(f) as avg_f from rf
)
select
a.user_id,
a.r,
a.f,
b.avg_r,
b.avg_f,
case
when a.r < avg_r and a.f > avg_f then '价值用户'
when a.r < avg_r and a.f <= avg_f then '发展用户'
when a.r >= avg_r and a.f > avg_f then '保持用户'
else '挽留用户'
end as '用户分类'
from rf as a,avgs as b
运行结果如下
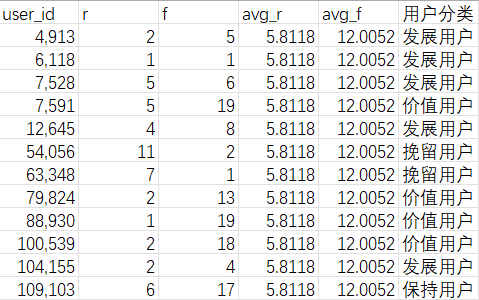
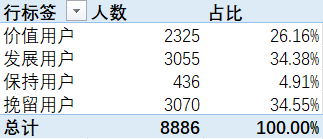
总结
对于价值用户,可以提供VIP服务以及定向优惠活动,对于他们所购买的商品种类,可以进行精准营销;
对于发展用户,想办法提高他们的购买频率,比如鼓励复购,发送基于购买周期的提醒邮件/推送;
对于保持用户,可以通过PUSH、短信、站内消息等方式,促进用户活跃度,提高他们的付费转化率;
对于挽留用户,需弄清楚这部分用户的需求,购物体验为什么没有达到预期,分析这部分用户流失的原因,想办法挽留用户。

魔乐社区(Modelers.cn) 是一个中立、公益的人工智能社区,提供人工智能工具、模型、数据的托管、展示与应用协同服务,为人工智能开发及爱好者搭建开放的学习交流平台。社区通过理事会方式运作,由全产业链共同建设、共同运营、共同享有,推动国产AI生态繁荣发展。
更多推荐

 9
9 0
0- 0


 已为社区贡献5条内容

所有评论(0)