python excel模板 生成excel表格_python制作简单excel统计报表3之将mysql数据库中的数据导入excel模板并生成统计图...
python制作简单excel统计报表3之将mysql数据库中的数据导入excel模板并生成统计图#coding=utf-8from openpyxl importload_workbookfrom openpyxl.chart import(AreaChart,Reference)importMySQLdbclassGaokaoExport(object):def __init__(self):
python制作简单excel统计报表3之将mysql数据库中的数据导入excel模板并生成统计图
#coding=utf-8
from openpyxl importload_workbookfrom openpyxl.chart import(
AreaChart,
Reference
)importMySQLdbclassGaokaoExport(object):def __init__(self):
self.wb= load_workbook('./static/tongji_example.xlsx')
self.ws=self.wb.active
self.ws.title= '成绩统计'self.ws.sheet_properties.tabColor= 'ff0000'
defget_conn(self):"""获取mysql 的链接"""
globalconntry:
conn=MySQLdb.connect(
db= 'user_grade',
host= 'localhost',
user= 'root',
password= 'root',
charset= 'utf8')except:pass
returnconndefexport_data(self):#取出数据库中的数据
conn =self.get_conn()
cur=conn.cursor()
sql= "select year,max,avg from score"cur.execute(sql)
rows=cur.fetchall()#循环写入到excel中
row_id = 10 #excel的第10行开始
for (i, row) inenumerate(rows):
(self.ws['C{0}'.format(row_id)],
self.ws['D{0}'.format(row_id)],
self.ws['E{0}'.format(row_id)]) =row
row_id+= 1
#显示图表
#参考:https://openpyxl.readthedocs.io/en/stable/charts/area.html#d-area-charts
chart =AreaChart()
chart.title= "成绩统计"chart.style= 13chart.x_axis.title= '年份'chart.y_axis.title= '分数'
#横坐标
cats = Reference(self.ws, min_col=3, min_row=10, max_row=row_id)#数据区域
data = Reference(self.ws, min_col=4, min_row=9, max_col=5, max_row=row_id)
chart.add_data(data, titles_from_data=True)
chart.set_categories(cats)
self.ws.add_chart(chart,"A{0}".format(row_id + 2))#保存到excel中
self.wb.save('./static/jieguo01.xlsx')
self.wb.close()if __name__ == "__main__":
client=GaokaoExport()
client.export_data()
mysql表数据:
create database user_grade charset=utf8mb4;
use user_grade;
SET NAMES utf8mb4;
SET FOREIGN_KEY_CHECKS = 0;
DROP TABLE IF EXISTS `score`;
CREATE TABLE `score` (
`id` int(11) UNSIGNED NOT NULL AUTO_INCREMENT,
`year` int(11) NULL DEFAULT NULL,
`max` int(11) NULL DEFAULT NULL,
`avg` int(11) NULL DEFAULT NULL,
PRIMARY KEY (`id`) USING BTREE
) ENGINE = InnoDB CHARACTER SET = utf8mb4 COLLATE = utf8mb4_bin;
INSERT INTO `score` VALUES (25, 2008, 700, 661);
INSERT INTO `score` VALUES (26, 2009, 690, 653);
INSERT INTO `score` VALUES (27, 2010, 699, 663);
INSERT INTO `score` VALUES (28, 2011, 690, 662);
INSERT INTO `score` VALUES (29, 2012, 702, 660);
INSERT INTO `score` VALUES (30, 2013, 720, 692);
INSERT INTO `score` VALUES (31, 2014, 719, 670);
INSERT INTO `score` VALUES (32, 2015, 721, 694);
INSERT INTO `score` VALUES (33, 2016, 715, 687);
INSERT INTO `score` VALUES (34, 2017, 705, 671);
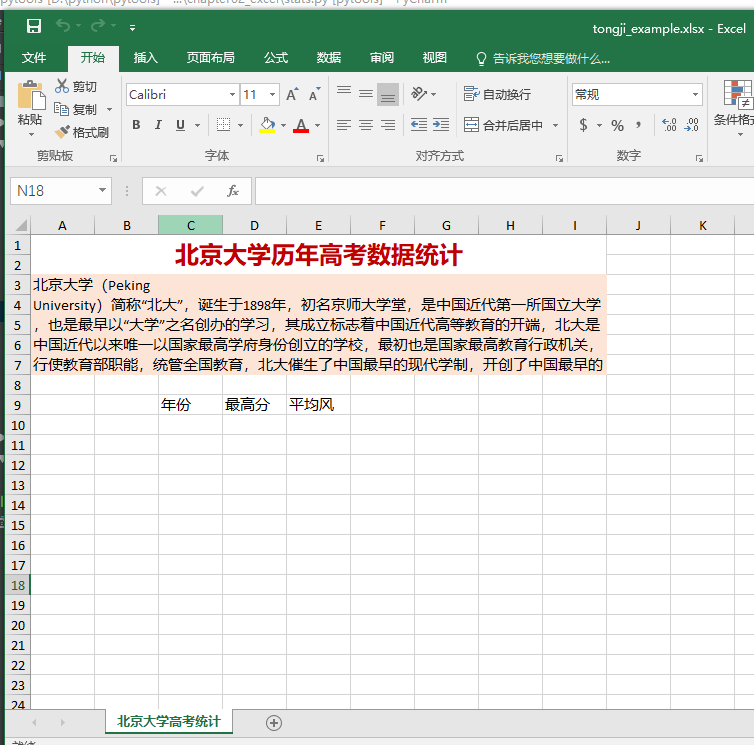
高考数据统计模板:
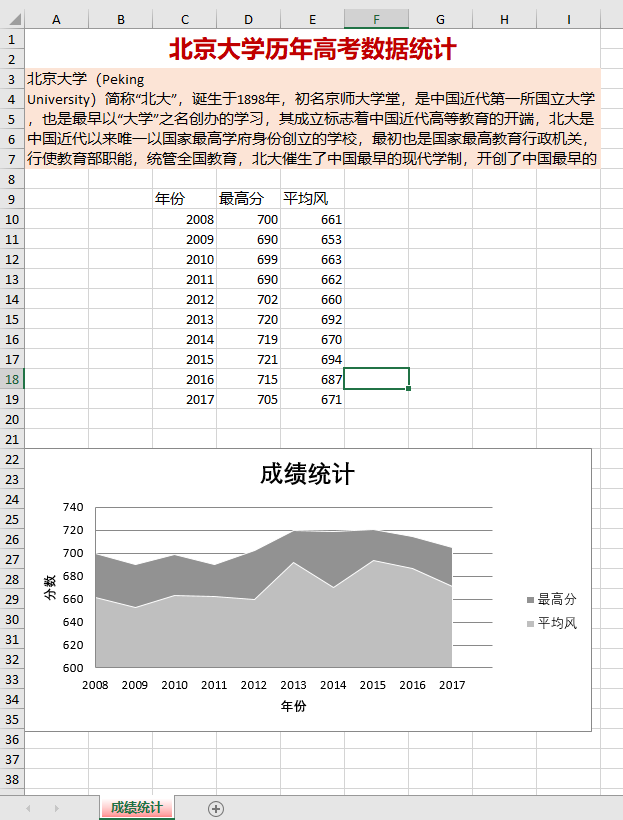
excel的统计结果

魔乐社区(Modelers.cn) 是一个中立、公益的人工智能社区,提供人工智能工具、模型、数据的托管、展示与应用协同服务,为人工智能开发及爱好者搭建开放的学习交流平台。社区通过理事会方式运作,由全产业链共同建设、共同运营、共同享有,推动国产AI生态繁荣发展。
更多推荐

 0
0 0
0- 0


 已为社区贡献5条内容

所有评论(0)