数据分析-时空分析
Knox方法基于临界空间和时间距离量化时空相互作用。测试统计量X是那些相距小于临界空间和时间距离的案例对的计数。当存在交互时,成对的案例将彼此接近,并且测试统计将很大。Knox设计了这种方法来考虑潜伏期。潜伏期是从暴露到症状出现之间的时间。如果你怀疑一种潜伏期为3天的疾病,将时间临界距离设置得足够长,以允许症状出现,比如4天或5天。ST-DBSCAN 以地理位置距离作为半径,时间范围作为高,在空间
I. 统计检验方法
Knox method
时空关联性分析
Description: The Knox method quantifies space-time interaction based on critical space and time distances. The test statistic, X, is a count of those pairs of cases that are separated by less than the critical space and time distances. Pairs of cases will be near to one another when interaction is present, and the test statistic will be large.
Knox designed this method to account for latency periods. A latency period is the time between exposure and the manifestation of symptoms. If you suspect a disease with a latency period of 3 days set the time critical distance long enough to allow symptoms to appear, say 4 or 5 days. For infectious diseases, the geographic critical distance reflects the average distance between 2 individuals, one of whom infected the other. In general, one selects critical distances consistent with the disease hypothesis under investigation. This hypothesis based approach avoids problems of subjectivity which arise when critical values are determined from the data.
from pointpats import knox
result = knox(events.space, events.t, delta=20, tau=5, permutations=99)
II. 机器学习方法
ST-DBSCAN
(Spatial–Temporal) ST-DBSCAN 以地理位置距离作为半径,时间范围作为高,在空间画圆柱,进行密度聚类检测异常点。使用KDTree,BallTree,Faiss进行近邻检索加速。
from datetime import timedelta
class STDBSCAN(object):

    def __init__(self, spatial_threshold=500.0, temporal_threshold=60.0,
                 min_neighbors=15):
        """
        Python ST-DBSCAN implementation.
        Because this algorithm needs to calculate multiple distances between
        points, it optimizes by assuming latitude and longitude columns in
        UTM projection. If it is not, convert them by using the
        `coordinates.convert_to_utm` available method.
        UTM projects onto a cylinder, and a cylinder is essentially flat (zero
        Gaussian curvature) so the Euclidean formula would be accurate for
        points on the cylinder (same Zone).
        :param spatial_threshold: Maximum geographical coordinate (spatial)
             distance value (meters);
        :param temporal_threshold: Maximum non-spatial distance value (seconds);
        :param min_neighbors: Minimum number of points within Eps1 and Eps2
             distance;
        """
        self.spatial_threshold = spatial_threshold
        self.temporal_threshold = temporal_threshold
        self.min_neighbors = min_neighbors

    def _retrieve_neighbors(self, index_center, matrix):

        center_point = matrix[index_center, :]

        # filter by time
        min_time = center_point[2] - timedelta(seconds=self.temporal_threshold)
        max_time = center_point[2] + timedelta(seconds=self.temporal_threshold)
        matrix = matrix[(matrix[:, 2] >= min_time) &
                        (matrix[:, 2] <= max_time), :]
        # filter by distance
        tmp = (matrix[:, 0]-center_point[0])*(matrix[:, 0]-center_point[0]) + \
            (matrix[:, 1]-center_point[1])*(matrix[:, 1]-center_point[1])
        neigborhood = matrix[tmp <= (
            self.spatial_threshold*self.spatial_threshold), 4].tolist()
        neigborhood.remove(index_center)

        return neigborhood

    def fit_transform(self, df, col_lat, col_lon, col_time,
                      col_cluster='cluster'):
        """
        :param df: DataFrame input
        :param col_lat: Latitude column name;
        :param col_lon:  Longitude column name;
        :param col_time: Date time column name;
        :param col_cluster: Alias for predicted cluster (default, 'cluster');
        """
        cluster_label = 0
        noise = -1
        unmarked = 777777
        stack = []

        # initial setup
        df = df[[col_lon, col_lat, col_time]]
        df[col_cluster] = unmarked
        df['index'] = range(df.shape[0])
        matrix = df.values
        df.drop(['index'], inplace=True, axis=1)

        # for each point in database
        for index in range(matrix.shape[0]):
            if matrix[index, 3] == unmarked:
                neighborhood = self._retrieve_neighbors(index, matrix)

                if len(neighborhood) < self.min_neighbors:
                    matrix[index, 3] = noise
                else:  # found a core point
                    cluster_label += 1
                    # assign a label to core point
                    matrix[index, 3] = cluster_label

                    # assign core's label to its neighborhood
                    for neig_index in neighborhood:
                        matrix[neig_index, 3] = cluster_label
                        stack.append(neig_index)  # append neighbors to stack

                    # find new neighbors from core point neighborhood
                    while len(stack) > 0:
                        current_point_index = stack.pop()
                        new_neighborhood = \
                            self._retrieve_neighbors(current_point_index,
                                                     matrix)

                        # current_point is a new core
                        if len(new_neighborhood) >= self.min_neighbors:
                            for neig_index in new_neighborhood:
                                neig_cluster = matrix[neig_index, 3]
                                if any([neig_cluster == noise,
                                        neig_cluster == unmarked]):
                                    matrix[neig_index, 3] = cluster_label
                                    stack.append(neig_index)

        df[col_cluster] = matrix[:, 3]
        return df


st_dbscan = STDBSCAN(spatial_threshold=1000, temporal_threshold=60*60*24*3,min_neighbors=5)
clusters = st_dbscan.fit_transform(df,col_lat='x',col_lon='y',col_time='date')
III. 代码库
PySAL
Python Spatial Analysis Library
https://pysal.org/packages/ https://pysal.org/packages/
Geopy
- 地理编码位置
- 根据经纬度计算距离
欢迎使用Geopy文档! — GeoPy 2.2.0 文档 https://www.osgeo.cn/geopy/
#地理编码
from geopy.geocoders import Nominatim
geolocator=Nominatim()
location= geolocator.geocode("北京市海淀区西二旗北路")
print(location.address)
print(location.latitude,location.longitude)

#逆地理编码
from geopy.geocoders import Nominatim
geolocator=Nominatim()
location= geolocator.reverse("40.056793 116.305811")
print(location.address)

#根据经纬度计算距离
from geopy import distance
newport_ri = (41.49008, -71.312796)
cleveland_oh = (41.499498, -81.695391)
print(distance.distance(newport_ri, cleveland_oh).miles) #最后以英里单位输出
print(distance.distance(wellington, salamanca).km) # 以 km 作为单位输出
Geopandas
DataFrame相当于GIS数据中的一张属性表,为了将pandas的特性用到空间数据,就有了geopandas。其目标是使得在python中操作地理数据更方便。
 https://geopandas.org/en/stable/index.html
Plotly
import plotly.graph_objects as go

# 在地图上画散点图
scatter = go.Scattermapbox(lat=data['Latitude'],       #设置纬度
                           lon=data['Longitude']      #设置经度
                          )                           #使用Scattermapbox函数画散点图
fig = go.Figure(scatter)       #将散点图导入画布
fig.update_layout(mapbox_style='stamen-terrain')      #将地图设置为画布
#可以使用的免费地图:"open-street-map", "carto-positron", "carto-darkmatter", "stamen-terrain", "stamen-toner" or "stamen-watercolor"

fig.show()
IV. 原理及概念
1. 地球坐标转换 (到直角坐标)
1.1 地理坐标系(Geographic coordinate system)
地理坐标系一般是指由经度、纬度和高度组成的坐标系,能够标示地球上的任何一个位置。前面提到了,不同地区可能会使用不同的参考椭球体,即使是使用相同的椭球体,也可能会为了让椭球体更好地吻合当地的大地水准面,而调整椭球体的方位,甚至大小。这就需要使用不同的大地测量系统(Geodetic datum)来标识。因此,对于地球上某一个位置来说,使用不同的测量系统,得到的坐标是不一样的。我们在处理地理数据时,必须先确认数据所用的测量系统。事实上,随着我们对地球形状测量的越来越精确,北美使用的 NAD83 基准和欧洲使用的 ETRS89 基准,与 WGS 84 基准是基本一致的,甚至我国的 CGCS2000 与WGS84之间的差异也是非常小的。但是差异非常小,不代表完全一致,以 NAD83 为例,因为它要保证北美地区的恒定,所以它与 WGS84 之间的差异在不断变化,对于美国大部分地区来说,每年有1-2cm的差异。
1.2. 投影坐标系(Projected coordinate systems)
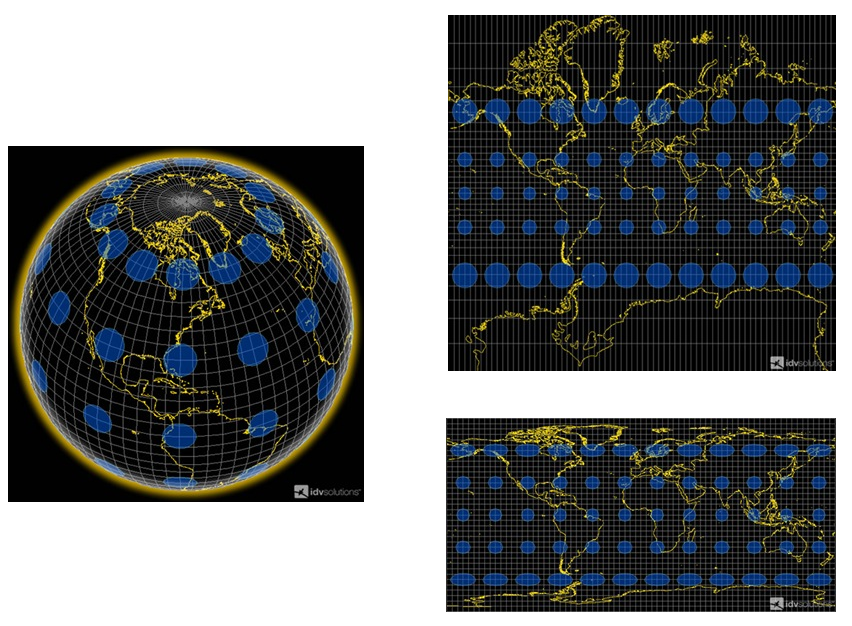
地理坐标系是三维的,我们要在地图或者屏幕上显示就需要转化为二维,这被称为投影(Map projection)。显而易见的是,从三维到二维的转化,必然会导致变形和失真,失真是不可避免的,但是不同投影下会有不同的失真,这让我们可以有得选择。常用的投影有等矩矩形投影(Platte Carre)和墨卡托投影(Mercator)
By Jakub Nowosad - Own work, CC BY-SA 4.0, Link
1.3 Web Map
EPSG:4326 (WGS84) and EPSG:3857(Pseudo-Mercator)
- EPSG:4326 (WGS84)
前面说了 WGS84 是目前最流行的地理坐标系统。在国际上,每个坐标系统都会被分配一个 EPSG 代码,EPSG:4326 就是 WGS84 的代码。GPS是基于WGS84的,所以通常我们得到的坐标数据都是WGS84的。一般我们在存储数据时,仍然按WGS84存储。
- EPSG:3857 (Pseudo-Mercator)
伪墨卡托投影,也被称为球体墨卡托,Web Mercator。它是基于墨卡托投影的,把 WGS84坐标系投影到正方形。
1.4. WSG84 转 UTM
# https://github.com/Turbo87/utm
import numpy as np
def from_latlon(latitude, longitude, force_zone_number=None, force_zone_letter=None):
    """This function converts Latitude and Longitude to UTM coordinate
        Parameters
        ----------
        latitude: float or NumPy array
            Latitude between 80 deg S and 84 deg N, e.g. (-80.0 to 84.0)
        longitude: float or NumPy array
            Longitude between 180 deg W and 180 deg E, e.g. (-180.0 to 180.0).
        force_zone_number: int
            Zone number is represented by global map numbers of an UTM zone
            numbers map. You may force conversion to be included within one
            UTM zone number.  For more information see utmzones [1]_
        force_zone_letter: str
            You may force conversion to be included within one UTM zone
            letter.  For more information see utmzones [1]_
        Returns
        -------
        easting: float or NumPy array
            Easting value of UTM coordinates
        northing: float or NumPy array
            Northing value of UTM coordinates
        zone_number: int
            Zone number is represented by global map numbers of a UTM zone
            numbers map. More information see utmzones [1]_
        zone_letter: str
            Zone letter is represented by a string value. UTM zone designators
            can be accessed in [1]_
       .. _[1]: http://www.jaworski.ca/utmzones.htm
    """

    def latlon_to_zone_number(latitude, longitude):
        # If the input is a numpy array, just use the first element
        # User responsibility to make sure that all points are in one zone
        if isinstance(latitude, np.ndarray):
            latitude = latitude.flat[0]
        if isinstance(longitude, np.ndarray):
            longitude = longitude.flat[0]
        if 56 <= latitude < 64 and 3 <= longitude < 12:
            return 32
        if 72 <= latitude <= 84 and longitude >= 0:
            if longitude < 9:
                return 31
            elif longitude < 21:
                return 33
            elif longitude < 33:
                return 35
            elif longitude < 42:
                return 37
        return int((longitude + 180) / 6) + 1

    def latitude_to_zone_letter(latitude):
        if -80 <= latitude <= 84:
            return ZONE_LETTERS[int(latitude / 8) + 10]
        return "Z"

    def zone_number_to_central_longitude(zone_number):
        return zone_number * 6 - 183

    def mod_angle(value):
        """Returns angle in radians to be between -pi and pi"""
        return (value + np.pi) % (2 * np.pi) - np.pi
    def mixed_signs(x):
        return np.min(x) < 0 and np.max(x) >= 0
    def negative(x):
        return np.max(x) < 0

    K0 = 0.9996

    E = 0.00669438
    E2 = E * E
    E3 = E2 * E
    E_P2 = E / (1 - E)

    SQRT_E = np.sqrt(1 - E)
    _E = (1 - SQRT_E) / (1 + SQRT_E)
    _E2 = _E * _E
    _E3 = _E2 * _E
    _E4 = _E3 * _E
    _E5 = _E4 * _E

    M1 = (1 - E / 4 - 3 * E2 / 64 - 5 * E3 / 256)
    M2 = (3 * E / 8 + 3 * E2 / 32 + 45 * E3 / 1024)
    M3 = (15 * E2 / 256 + 45 * E3 / 1024)
    M4 = (35 * E3 / 3072)

    P2 = (3 / 2 * _E - 27 / 32 * _E3 + 269 / 512 * _E5)
    P3 = (21 / 16 * _E2 - 55 / 32 * _E4)
    P4 = (151 / 96 * _E3 - 417 / 128 * _E5)
    P5 = (1097 / 512 * _E4)

    R = 6378137

    ZONE_LETTERS = "CDEFGHJKLMNPQRSTUVWXX"

    lat_rad = np.radians(latitude)
    lat_sin = np.sin(lat_rad)
    lat_cos = np.cos(lat_rad)

    lat_tan = lat_sin / lat_cos
    lat_tan2 = lat_tan * lat_tan
    lat_tan4 = lat_tan2 * lat_tan2

    if force_zone_number is None:
        zone_number = latlon_to_zone_number(latitude, longitude)
    else:
        zone_number = force_zone_number

    if force_zone_letter is None:
        zone_letter = latitude_to_zone_letter(latitude)
    else:
        zone_letter = force_zone_letter

    lon_rad = np.radians(longitude)
    central_lon = zone_number_to_central_longitude(zone_number)
    central_lon_rad = np.radians(central_lon)

    n = R / np.sqrt(1 - E * lat_sin**2)
    c = E_P2 * lat_cos**2

    a = lat_cos * mod_angle(lon_rad - central_lon_rad)
    a2 = a * a
    a3 = a2 * a
    a4 = a3 * a
    a5 = a4 * a
    a6 = a5 * a

    m = R * (M1 * lat_rad -
             M2 * np.sin(2 * lat_rad) +
             M3 * np.sin(4 * lat_rad) -
             M4 * np.sin(6 * lat_rad))

    easting = K0 * n * (a +
                        a3 / 6 * (1 - lat_tan2 + c) +
                        a5 / 120 * (5 - 18 * lat_tan2 + lat_tan4 + 72 * c - 58 * E_P2)) + 500000

    northing = K0 * (m + n * lat_tan * (a2 / 2 +
                                        a4 / 24 * (5 - lat_tan2 + 9 * c + 4 * c**2) +
                                        a6 / 720 * (61 - 58 * lat_tan2 + lat_tan4 + 600 * c - 330 * E_P2)))

    if mixed_signs(latitude):
        raise ValueError("latitudes must all have the same sign")
    elif negative(latitude):
        northing += 10000000

    return easting, northing, zone_number, zone_letter
2. 经纬度转换地理位置
(批量离线转换代码)
reverse-geocoder: 离线将经纬度转换为地理位置
import reverse_geocoder as rg

coordinates = (51.5214588,-0.1729636),(9.936033, 76.259952),(37.38605,-122.08385)
results = rg.search(coordinates) # default mode = 2
拓展阅读
时空犯罪预测代码
GitHub - QuantCrimAtLeeds/PredictCode at e2a2d5a8fa5d83f011c33e18d4ce6ac7e1429aa8
References

魔乐社区(Modelers.cn) 是一个中立、公益的人工智能社区,提供人工智能工具、模型、数据的托管、展示与应用协同服务,为人工智能开发及爱好者搭建开放的学习交流平台。社区通过理事会方式运作,由全产业链共同建设、共同运营、共同享有,推动国产AI生态繁荣发展。
更多推荐

 6
6 0
0- 0


 已为社区贡献9条内容

所有评论(0)