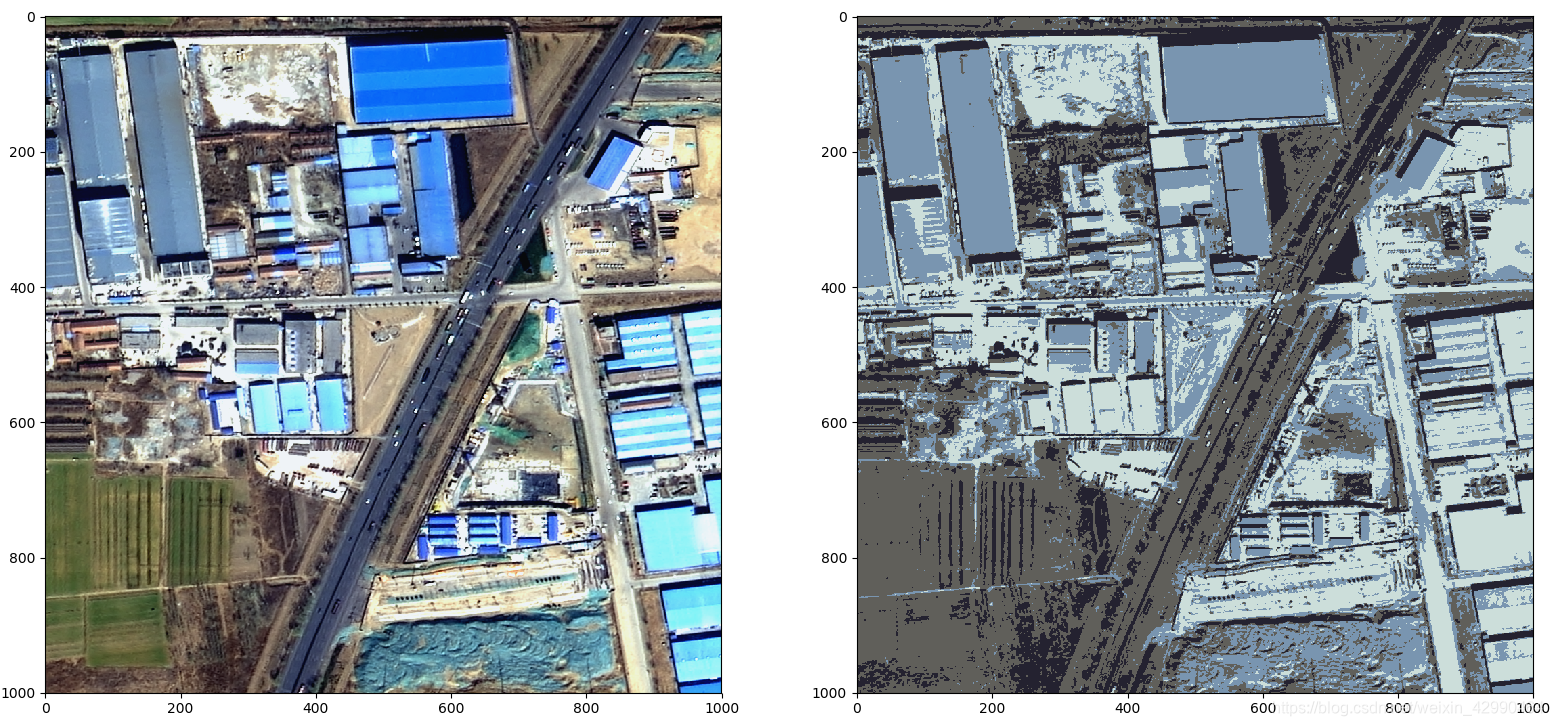
无监督图像分割(kmeans)
简单介绍在众多聚类算法中,K-Means 算得上是其中一个经典的算法之一了,它属于无监督学习成员的一份子,训练并分类数据的过程中,不需要标签的辅助就能够掌握每一比数据之间的潜在关系,而这个关系则是通过两个点之间的距离远近来判定,离得远的表示关系小,离得近的表示关系大。代码(python)import numpy as npimport matplotlib.pyplot as pltimport
·
简单介绍
在众多聚类算法中,K-Means 算得上是其中一个经典的算法之一了,它属于无监督学习成员的一份子,训练并分类数据的过程中,不需要标签的辅助就能够掌握每一比数据之间的潜在关系,而这个关系则是通过两个点之间的距离远近来判定,离得远的表示关系小,离得近的表示关系大。
代码(python)
import numpy as np
import matplotlib.pyplot as plt
import cv2
from sklearn.cluster import KMeans

img = cv2.imread(r'D:\2021\6\unsupervisedSegmentation\Unsupervised-Segmentation-master\image\00000022.tif')#BGR format
img = cv2.cvtColor(img, cv2.COLOR_BGR2RGB)
raw_img = img.copy()

print(img.shape)
width = img.shape[0]
height = img.shape[1]

#we are creating segmentation of K colors
#firstly, we will find K dominating colors in an image using K means clustering

#we have RGB image(3 channels) so we will use 3 channels values as features
img = img.reshape(-1,3)
print(img.shape)

k = 4   #number of dominating colors you want

classifier = KMeans(n_clusters=k,max_iter=100,
                init='k-means++')
kmeans = classifier.fit(img)

labels = kmeans.labels_
print(f'labels:{labels}')

dominating_colors = np.array(kmeans.cluster_centers_,dtype='uint8')

print(dominating_colors)
colors = []

for col in dominating_colors:
	r = col[0]
	g = col[1]
	b = col[2]
	colors.append([r, g, b])

segmented_img = np.zeros((img.shape[0],3),dtype='uint8')

for pix in range(segmented_img.shape[0]):
	r_g_b = colors[labels[pix]]
	segmented_img[pix] = r_g_b

segmented_img = segmented_img.reshape((width,height,3))
plt.subplot(121)
plt.imshow(raw_img)
plt.subplot(122)
plt.imshow(segmented_img)
plt.show()

魔乐社区(Modelers.cn) 是一个中立、公益的人工智能社区,提供人工智能工具、模型、数据的托管、展示与应用协同服务,为人工智能开发及爱好者搭建开放的学习交流平台。社区通过理事会方式运作,由全产业链共同建设、共同运营、共同享有,推动国产AI生态繁荣发展。
更多推荐
 0
0 0
0- 0


 已为社区贡献46条内容

所有评论(0)