matlab如何画双x坐标,matlab画双坐标图
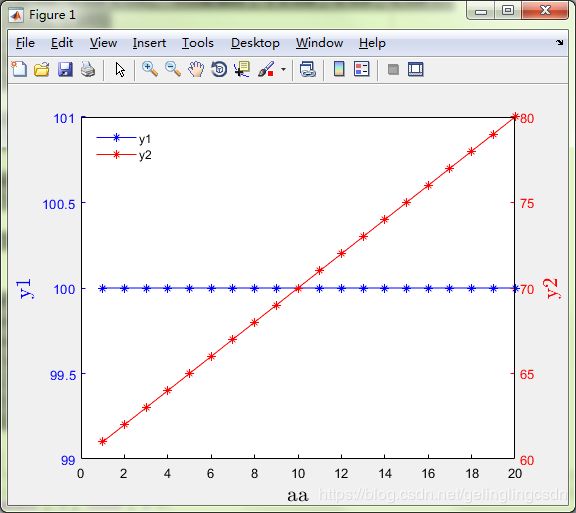
整理了一下matlab画双坐标的代码,具体如下。如果想分别设置双坐标的label,可以设置Ylim,YTick和YTickLabel。clc;clear;x=1:20;y1=100*ones(1,20);y2=61:1:80;figure(1)[ax,h1,h2]=plotyy(x,y1,x,y2,'plot','plot');xlabel('aa','Fontsize', 16,'Interpr
整理了一下matlab画双坐标的代码,具体如下。如果想分别设置双坐标的label,可以设置Ylim,YTick和YTickLabel。
clc;clear;
x=1:20;
y1=100*ones(1,20);
y2=61:1:80;
figure(1)
[ax,h1,h2]=plotyy(x,y1,x,y2,'plot','plot');
xlabel('aa','Fontsize', 16,'Interpreter','latex')
set(ax(1),'XColor','k','YColor','b');
set(ax(2),'XColor','k','YColor','r');
%坐标1标注
set(get(ax(1),'Ylabel'),'String','y1','Fontsize', 16,'Interpreter','latex','color','b');
set(h1,'LineStyle','-','marker','*','color','b');
%坐标2标注
set(get(ax(2),'Ylabel'),'String','y2','Fontsize', 16,'Interpreter','latex','color','r');
set(h2,'LineStyle','-','marker','*','color','r');
%legend
legend({'y1','y2'},'Location','NorthWest')
legend boxoff;
box off
ax2 = axes('Position',get(gca,'Position'),...
'XAxisLocation','top',...
'YAxisLocation','right',...
'Color','none',...
'XColor','k','YColor','k');
set(ax2,'YTick', []);
set(ax2,'XTick', []);
box on

魔乐社区(Modelers.cn) 是一个中立、公益的人工智能社区,提供人工智能工具、模型、数据的托管、展示与应用协同服务,为人工智能开发及爱好者搭建开放的学习交流平台。社区通过理事会方式运作,由全产业链共同建设、共同运营、共同享有,推动国产AI生态繁荣发展。
更多推荐
 1
1 0
0- 0


 已为社区贡献2条内容

所有评论(0)