安装和使用grafana+prometheus+node_exporter监控linux服务器CPU,内存,磁盘等资源
1.安装prometheus和配置访问不了官网的下载地址,从网上找了百度云的地址下载,然后上传到自己的阿里云服务器上安装还是挺简单的, 参考文章:https://www.cnblogs.com/xiangsikai/p/11288801.htmlprometheus的数据保存路径:/usr/local/prometheus/data2.要监控的服务器上安装node_exporter在要监控的服务器
1.要监控的服务器上安装node_exporter
在要监控的服务器上安装node_exporter
参考文章:https://www.cnblogs.com/xiangsikai/p/11289157.html
2.安装prometheus和配置**
访问不了官网的下载地址,从网上找了百度云的地址下载,然后上传到自己的阿里云服务器上
安装还是挺简单的, 参考文章:
https://www.cnblogs.com/xiangsikai/p/11288801.html
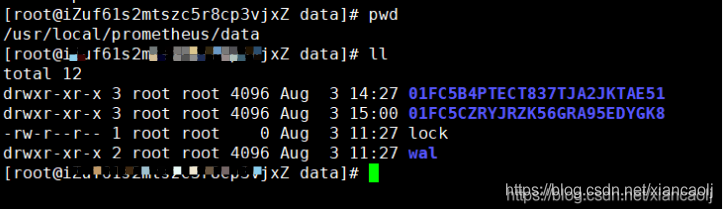
prometheus的数据保存路径:
/usr/local/prometheus/data
配置prometheus.yml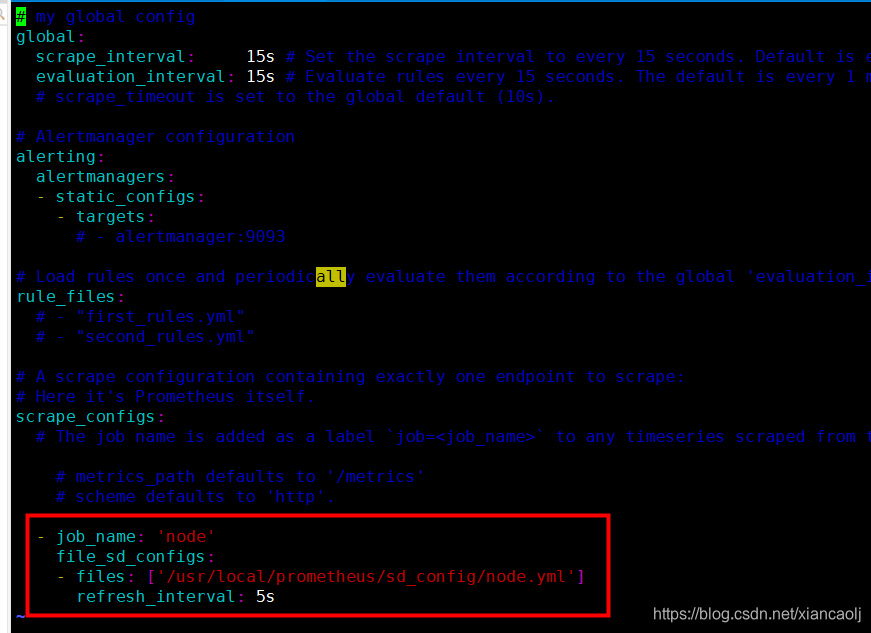
scrape_configs:
- job_name: ‘node’
file_sd_configs:- files: [’/usr/local/prometheus/sd_config/node.yml’]
refresh_interval: 5s
- files: [’/usr/local/prometheus/sd_config/node.yml’]
node.yml上配置安装了node_exporter的服务器地址和端口,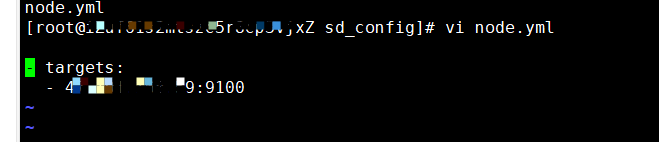
3.安装grafana和配置
wget https://dl.grafana.com/oss/release/grafana-8.0.6-1.x86_64.rpm
sudo yum install grafana-8.0.6-1.x86_64.rpm
systemctl start grafana-server
浏览器通过3000端口访问
http://{IP}:3000
配置参考文章:https://blog.csdn.net/p1i2n3g4/article/details/114753095
如果是阿里云的话,记得开放外网端口
看到的效果: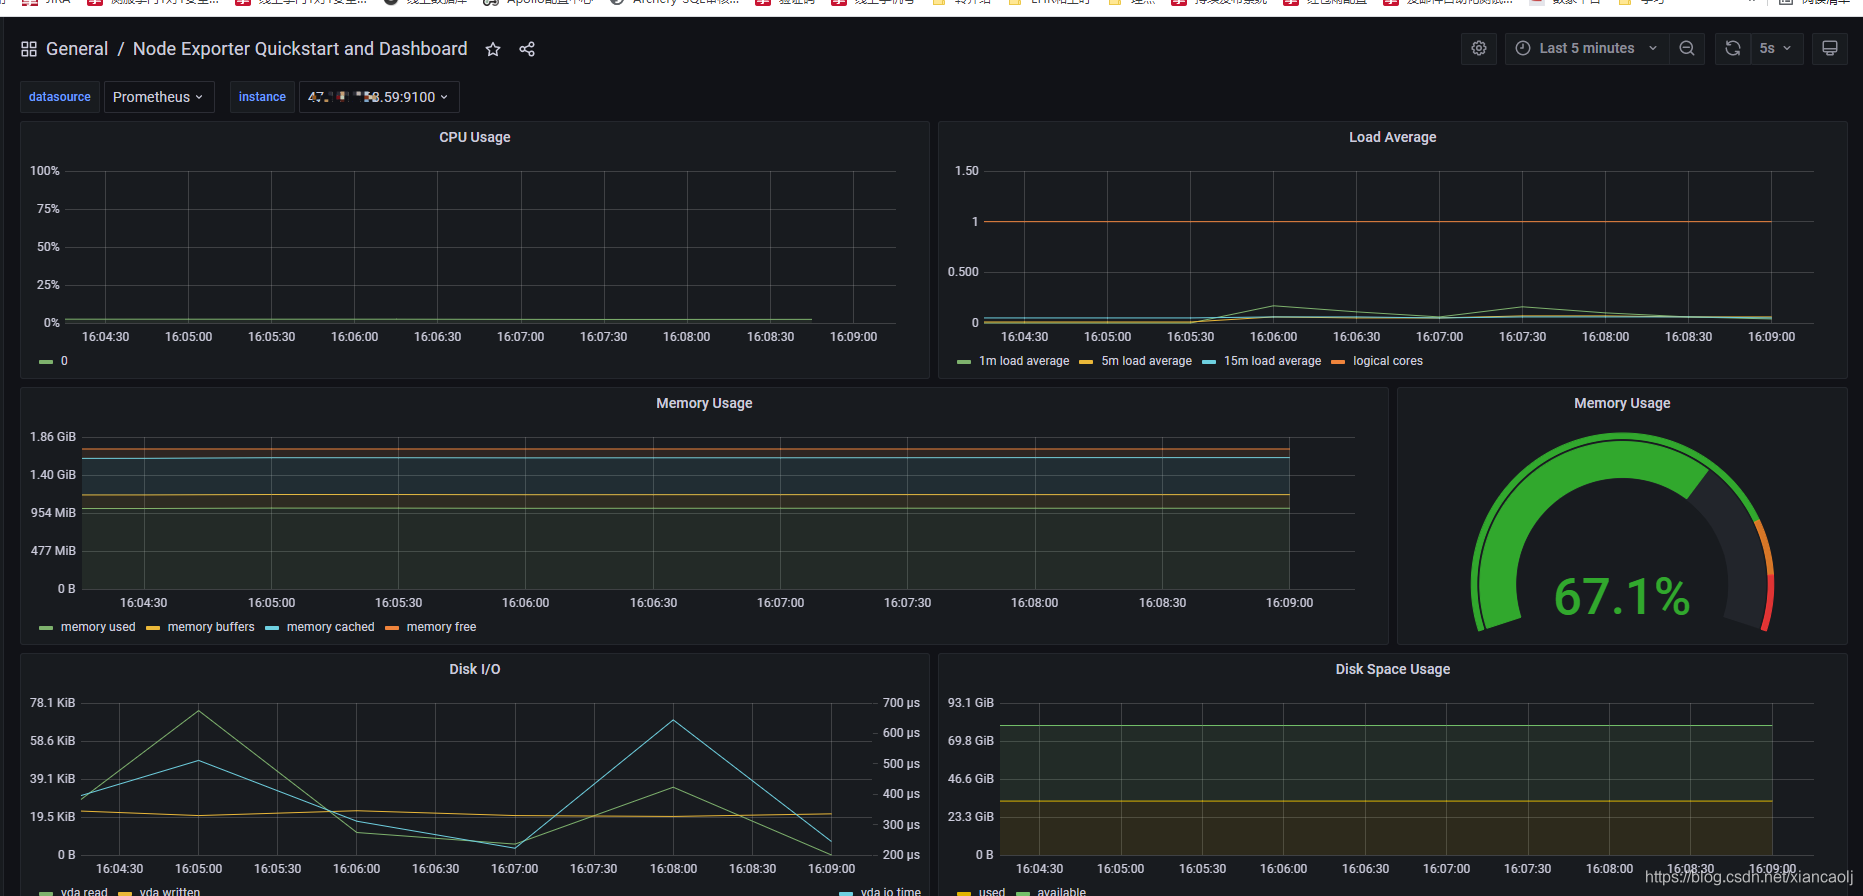
模板地址:https://grafana.com/grafana/dashboards/13978?pg=dashboards&plcmt=featured-sub1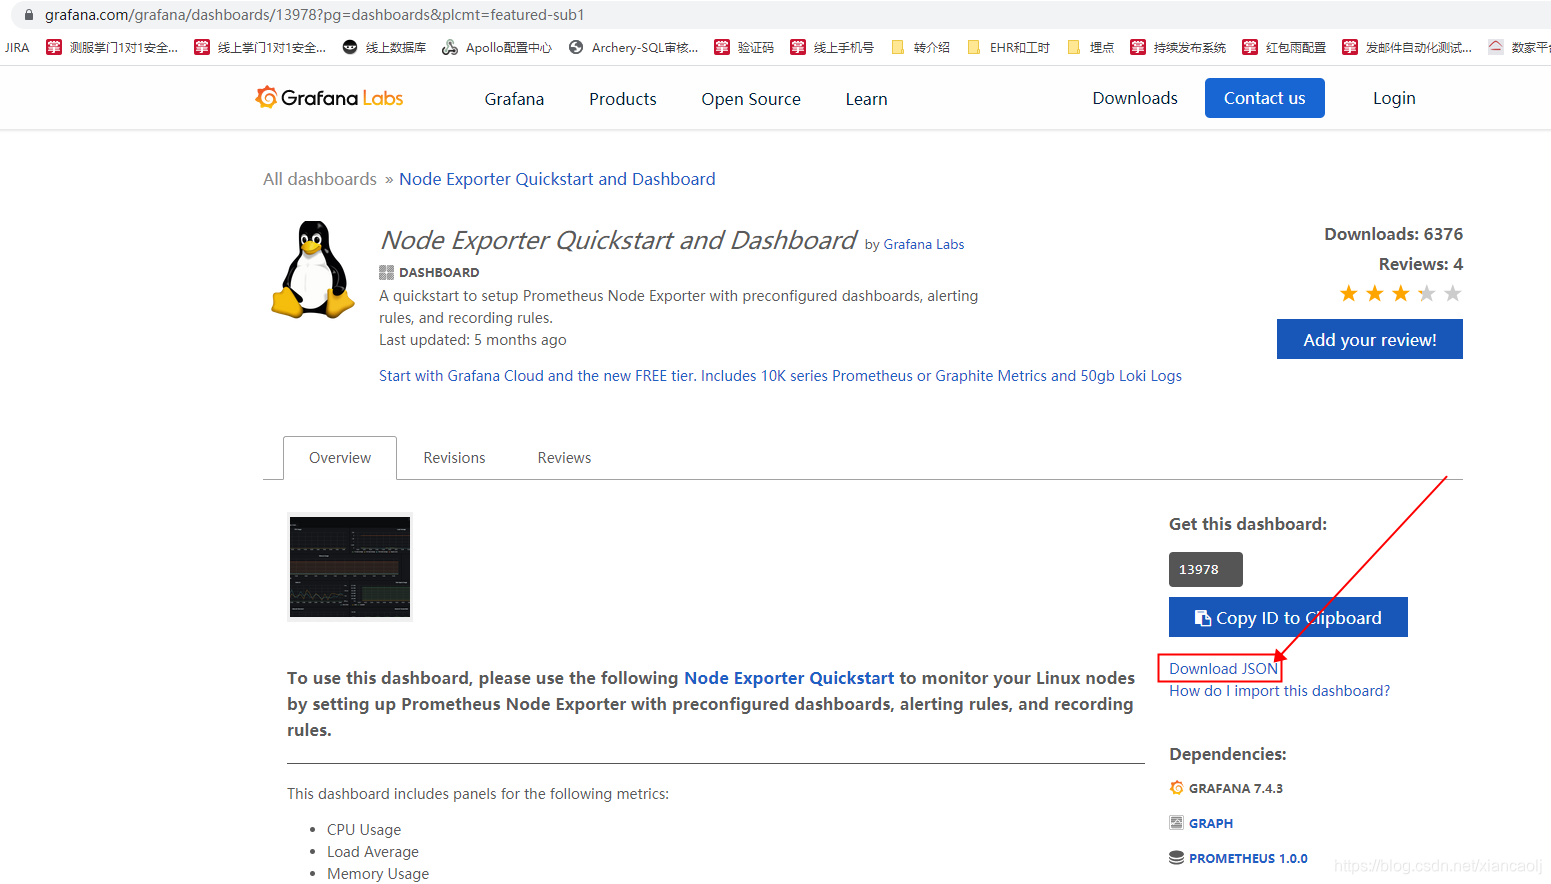

魔乐社区(Modelers.cn) 是一个中立、公益的人工智能社区,提供人工智能工具、模型、数据的托管、展示与应用协同服务,为人工智能开发及爱好者搭建开放的学习交流平台。社区通过理事会方式运作,由全产业链共同建设、共同运营、共同享有,推动国产AI生态繁荣发展。
更多推荐

 0
0 0
0- 0


 已为社区贡献3条内容

所有评论(0)