echarts使用数据集分别描绘两种类型图
echarts使用数据集分别描绘两种类型图使用数据集初尝试option详细配置项和数据数据集dataset设置指定数据所要展示的图表类型完整js代码使用数据集根据echarts官网使用手册,数据集(dataset)是专门用来管理数据的组件。虽然每个系列都可以在 series.data 中设置数据,但是从 ECharts4 支持 数据集 开始,更推荐使用 数据集 来管理数据。因为这样,数据可以被多个
·
echarts使用数据集分别描绘两种类型图
使用数据集
根据echarts官网使用手册,数据集(dataset)是专门用来管理数据的组件。虽然每个系列都可以在 series.data 中设置数据,但是从 ECharts4 支持 数据集 开始,更推荐使用 数据集 来管理数据。因为这样,数据可以被多个组件复用,也方便进行 “数据和其他配置” 分离的配置风格。
初尝试
要求在同一页面中摆放两种图表: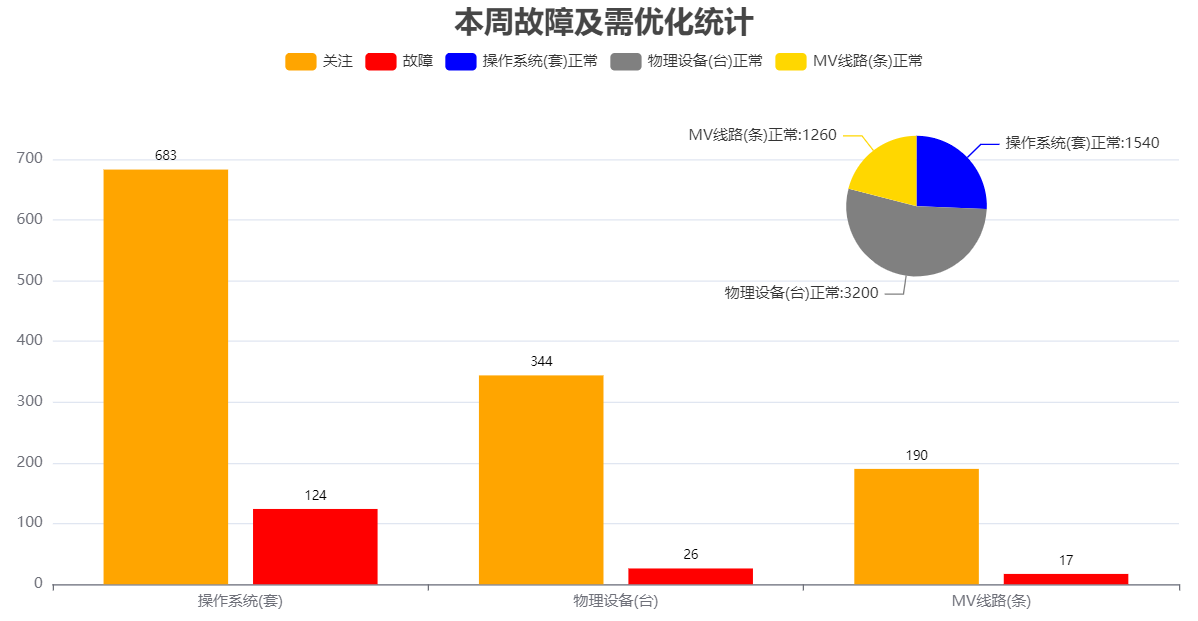
option详细配置项和数据
option = {
            title: {
                text: '本周故障及需优化统计',
                textStyle: {
                    fontSize: 24
                },
                left: 'center',
            },
            tooltip: {
                formatter: function (value) {
                    console.log(value);
                    if (value.componentSubType == 'pie') {
                        return `${value.marker + value.name}:${value.value.正常}`
                    } else {
                        if (value.seriesName == '关注') {
                            return `
                            ${value.seriesName}<br>
                            ${value.marker + value.name}:${value.value.关注}`
                        } else if (value.seriesName == '故障') {
                            return `
                            ${value.seriesName}<br>
                            ${value.marker + value.name}:${value.value.故障}`
                        }
                    }
                }
            },
            legend: {
                top: '7%',
            },
            grid: {
                left: '3%',
                right: '4%',
                bottom: '3%',
                top: '25%',
                // 开启距离包含坐标轴上的文字
                containLabel: true,
            },
            dataset: [
                {
                    dimensions: ['product', '关注', '故障'],
                    source: [
                        { product: '操作系统(套)', 关注: calc(osData, 'focus'), 故障: calc(osData, 'err') },
                        { product: '物理设备(台)', 关注: calc(pDevData, 'focus'), 故障: calc(pDevData, 'err') },
                        { product: 'MV线路(条)', 关注: calc(mvData, 'focus'), 故障: calc(mvData, 'err') },
                    ]
                },
                {
                    source: [
                        { product: '操作系统(套)正常', 正常: calc(osData, 'normal') },
                        { product: '物理设备(台)正常', 正常: calc(pDevData, 'normal') },
                        { product: 'MV线路(条)正常', 正常: calc(mvData, 'normal') },

                    ]
                }
            ],
            xAxis: {
                type: 'category',
            },
            yAxis: {},
            series: [
                {
                    type: 'bar',
                    itemStyle: {
                        normal: {
                            color: 'orange',
                            label: {
                                show: true, //开启显示
                                position: 'top', //在上方显示
                                textStyle: { //数值样式
                                    color: 'black',
                                    fontSize: 10
                                }
                            }
                        }
                    }
                },
                {
                    type: 'bar',
                    itemStyle: {
                        normal: {
                            color: 'red',
                            label: {
                                show: true, //开启显示
                                position: 'top', //在上方显示
                                textStyle: { //数值样式
                                    color: 'black',
                                    fontSize: 10
                                }
                            }
                        }
                    }
                },
                {
                    type: 'pie',
                    radius: '25%',
                    center: ['75%', '25%'],
                    top: '10%',
                    label: {
                        formatter: function (a) {
                            console.log(a);
                            return `${a.name}:${a.data.正常}`
                        }
                    },
                    datasetIndex: 1,
                    color: ['blue', 'grey', 'gold']
                }
            ]
        };
数据集dataset设置
dataset: [
				// 柱形图数据集
                {
                // 用 dimensions 指定了维度的顺序。直角坐标系中,如果 X 轴 type 为 类目轴category,
                // 默认把第一个维度映射到 X 轴上,后面维度映射到 Y 轴上。
                    dimensions: ['product', '关注', '故障'],
                    source: [
                        { product: '操作系统(套)', 关注: calc(osData, 'focus'), 故障: calc(osData, 'err') },
                        { product: '物理设备(台)', 关注: calc(pDevData, 'focus'), 故障: calc(pDevData, 'err') },
                        { product: 'MV线路(条)', 关注: calc(mvData, 'focus'), 故障: calc(mvData, 'err') },
                    ]
                },
                // 饼形图数据集
                {
                    source: [
                        { product: '操作系统(套)正常', 正常: calc(osData, 'normal') },
                        { product: '物理设备(台)正常', 正常: calc(pDevData, 'normal') },
                        { product: 'MV线路(条)正常', 正常: calc(mvData, 'normal') },
                    ]
                }
            ],
从图例可以看出利用dimensions指定维度顺序,把第一个维度属性名product的三种数据类型名称都给映射到X轴上,剩下两个维度属性名为“关注”和“故障”都给映射到Y轴上了。
然后我们就可以在source里面配置各类型的数据了。
指定数据所要展示的图表类型
series: [
                {
                    type: 'bar',
                    // 设置自定义样式
                    itemStyle: {
                        normal: {
                            color: 'orange',
                            label: {
                                show: true, //开启显示
                                position: 'top', //在上方显示
                                textStyle: { //数值样式
                                    color: 'black',
                                    fontSize: 10
                                }
                            }
                        }
                    }
                },
                {
                    type: 'bar',
                    itemStyle: {
                        normal: {
                            color: 'red',
                            label: {
                                show: true, //开启显示
                                position: 'top', //在上方显示
                                textStyle: { //数值样式
                                    color: 'black',
                                    fontSize: 10
                                }
                            }
                        }
                    }
                },
                {
                    type: 'pie',
                    // 设置饼图半径
                    radius: '25%',
                    // 设置饼图位置
                    center: ['75%', '25%'],
                    top: '10%',
                    // 设置饼图文本标签内容样式
                    label: {
                        formatter: function (a) {
                            console.log(a);
                            return `${a.name}:${a.data.正常}`
                        }
                    },
                    // 指定该图表使用数据集dataset中的第二个数据,也就是饼状图数据集
                    datasetIndex: 1,
                    // 设置饼图每一块的颜色
                    color: ['blue', 'grey', 'gold']
                }
            ]
如果有多个数据集,则需要在series中对相应的图表类型设置datasetIndex,来指定该图表使用哪一个数据集。
完整js代码
<script>
        var BarBOX1 = echarts.init(document.getElementById("test"))
        let data = [
            { type: '物理设备', normal: 2000, focus: 50, err: 5, date: '2021-10-10', user: 'abc' },
            { type: '物理设备', normal: 200, focus: 58, err: 1, date: '2021-10-11', user: 'abc' },
            { type: '物理设备', normal: 200, focus: 48, err: 2, date: '2021-10-12', user: 'abc' },
            { type: '物理设备', normal: 200, focus: 47, err: 7, date: '2021-10-13', user: 'abc' },
            { type: '物理设备', normal: 200, focus: 54, err: 4, date: '2021-10-14', user: 'abc' },
            { type: '物理设备', normal: 200, focus: 47, err: 4, date: '2021-10-15', user: 'abc' },
            { type: '物理设备', normal: 200, focus: 40, err: 3, date: '2021-10-16', user: 'abc' },
            { type: '操作系统', normal: 220, focus: 110, err: 20, date: '2021-10-10', user: 'abc' },
            { type: '操作系统', normal: 220, focus: 102, err: 11, date: '2021-10-11', user: 'abc' },
            { type: '操作系统', normal: 220, focus: 77, err: 18, date: '2021-10-12', user: 'abc' },
            { type: '操作系统', normal: 220, focus: 98, err: 19, date: '2021-10-13', user: 'abc' },
            { type: '操作系统', normal: 220, focus: 101, err: 21, date: '2021-10-14', user: 'abc' },
            { type: '操作系统', normal: 220, focus: 88, err: 16, date: '2021-10-15', user: 'abc' },
            { type: '操作系统', normal: 220, focus: 107, err: 19, date: '2021-10-16', user: 'abc' },
            { type: 'MV线路', normal: 180, focus: 27, err: 1, date: '2021-10-10', user: 'abc' },
            { type: 'MV线路', normal: 180, focus: 36, err: 0, date: '2021-10-11', user: 'abc' },
            { type: 'MV线路', normal: 180, focus: 17, err: 2, date: '2021-10-12', user: 'abc' },
            { type: 'MV线路', normal: 180, focus: 28, err: 4, date: '2021-10-13', user: 'abc' },
            { type: 'MV线路', normal: 180, focus: 36, err: 5, date: '2021-10-14', user: 'abc' },
            { type: 'MV线路', normal: 180, focus: 17, err: 1, date: '2021-10-15', user: 'abc' },
            { type: 'MV线路', normal: 180, focus: 29, err: 4, date: '2021-10-16', user: 'abc' },
        ];
        let pDevData = data.filter((value, index, arr) => {
            return value.type == '物理设备'
        })
        let osData = data.filter((value, index, arr) => {
            return value.type == '操作系统'
        })
        let mvData = data.filter((value, index, arr) => {
            return value.type == 'MV线路'
        })
        // 计算周数据
        function calc(data, str) {
            let total = 0
            data.forEach((value, index, arr) => {
                total += value[str];
            })
            // console.log(total);
            return total
        }
        option = {
            title: {
                text: '本周故障及需优化统计',
                textStyle: {
                    fontSize: 24
                },
                left: 'center',
            },
            // 设置提示框样式
            tooltip: {
                formatter: function (value) {
                    // console.log(value);
                    if (value.componentSubType == 'pie') {
                        return `${value.marker + value.name}:${value.value.正常}`
                    } else {
                        if (value.seriesName == '关注') {
                            return `
                            ${value.seriesName}<br>
                            ${value.marker + value.name}:${value.value.关注}`
                        } else if (value.seriesName == '故障') {
                            return `
                            ${value.seriesName}<br>
                            ${value.marker + value.name}:${value.value.故障}`
                        }
                    }
                }
            },
            legend: {
                top: '7%',
            },
            grid: {
                left: '3%',
                right: '4%',
                bottom: '3%',
                top: '25%',
                // 开启距离包含坐标轴上的文字
                containLabel: true,
            },
            dataset: [
                {
                    dimensions: ['product', '关注', '故障'],
                    source: [
                        { product: '操作系统(套)', 关注: calc(osData, 'focus'), 故障: calc(osData, 'err') },
                        { product: '物理设备(台)', 关注: calc(pDevData, 'focus'), 故障: calc(pDevData, 'err') },
                        { product: 'MV线路(条)', 关注: calc(mvData, 'focus'), 故障: calc(mvData, 'err') },
                    ]
                },
                {
                    source: [
                        { product: '操作系统(套)正常', 正常: calc(osData, 'normal') },
                        { product: '物理设备(台)正常', 正常: calc(pDevData, 'normal') },
                        { product: 'MV线路(条)正常', 正常: calc(mvData, 'normal') },

                    ]
                }
            ],
            xAxis: {
                type: 'category',
            },
            yAxis: {},
            series: [
                {
                    type: 'bar',
                    itemStyle: {
                        normal: {
                            color: 'orange',
                            label: {
                                show: true, //开启显示
                                position: 'top', //在上方显示
                                textStyle: { //数值样式
                                    color: 'black',
                                    fontSize: 10
                                }
                            }
                        }
                    }
                },
                {
                    type: 'bar',
                    itemStyle: {
                        normal: {
                            color: 'red',
                            label: {
                                show: true, //开启显示
                                position: 'top', //在上方显示
                                textStyle: { //数值样式
                                    color: 'black',
                                    fontSize: 10
                                }
                            }
                        }
                    }
                },
                {
                    type: 'pie',
                    radius: '35%',
                    center: ['75%', '25%'],
                    top: '10%',
                    label: {
                        formatter: function (a) {
                            console.log(a);
                            return `${a.name}:${a.data.正常}`
                        }
                    },
                    datasetIndex: 1,
                    color: ['blue', 'grey', 'gold']
                }
            ]
        };

        BarBOX1.setOption(option)
    </script>

魔乐社区(Modelers.cn) 是一个中立、公益的人工智能社区,提供人工智能工具、模型、数据的托管、展示与应用协同服务,为人工智能开发及爱好者搭建开放的学习交流平台。社区通过理事会方式运作,由全产业链共同建设、共同运营、共同享有,推动国产AI生态繁荣发展。
更多推荐

 0
0 0
0- 0


 已为社区贡献1条内容

所有评论(0)