【机器学习实战】分类算法评估之ROC曲线绘制(多模型对比)
·
1. 代码
import numpy as np
import matplotlib.pyplot as plt
from sklearn.datasets import make_classification
from sklearn.linear_model import LogisticRegression
from sklearn.tree import DecisionTreeClassifier
from sklearn.ensemble import RandomForestClassifier
from sklearn.metrics import roc_curve, roc_auc_score
from sklearn.model_selection import train_test_split
# 生成样本数据
X, y = make_classification(n_samples=1000, n_features=10, n_classes=2, random_state=42)
# 将数据集分为训练集和测试集
X_train, X_test, y_train, y_test = train_test_split(X, y, test_size=0.3, random_state=42)
# 初始化分类器
classifiers = [
('Logistic Regression', LogisticRegression()),
('Decision Tree', DecisionTreeClassifier()),
('Random Forest', RandomForestClassifier())
]
# 遍历每个分类器,训练并绘制ROC曲线
for name, classifier in classifiers:
classifier.fit(X_train, y_train)
y_pred_proba = classifier.predict_proba(X_test)[:,1]
fpr, tpr, _ = roc_curve(y_test, y_pred_proba)
auc = roc_auc_score(y_test, y_pred_proba)
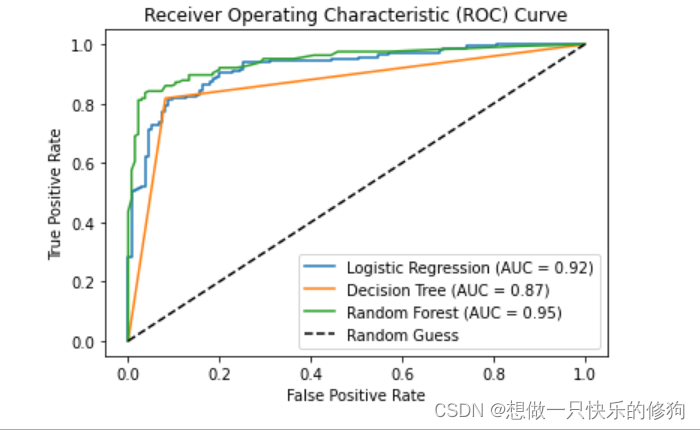
plt.plot(fpr, tpr, label=f'{name} (AUC = {auc:.2f})')
# 绘制基准线
plt.plot([0, 1], [0, 1], 'k--', label='Random Guess')
# 设置图例、标题、坐标轴标签等信息
plt.legend()
plt.title('Receiver Operating Characteristic (ROC) Curve')
plt.xlabel('False Positive Rate')
plt.ylabel('True Positive Rate')
plt.show()
2. 结果

魔乐社区(Modelers.cn) 是一个中立、公益的人工智能社区,提供人工智能工具、模型、数据的托管、展示与应用协同服务,为人工智能开发及爱好者搭建开放的学习交流平台。社区通过理事会方式运作,由全产业链共同建设、共同运营、共同享有,推动国产AI生态繁荣发展。
更多推荐


 2
2 0
0- 0


 已为社区贡献22条内容

所有评论(0)