[OpenPCDet]ROS下开发三维目标检测以及目标追踪
ROS的3d检测和追踪在KITTI上的测试
前言:kitti数据集应该是一个3维场景下的目标检测和追踪数据集,但是我发现现在网上大多只给出了3d检测的实现,对于追踪的任务已经没什么人做研究了。2D场景下,常见的追踪算法有sort和deepsort,其中deepsort还需要训练一个feature学习器,因此还是从简单的sort进行实现。本文的主要目标是在完成3D检测后,还想要对检测目标进行追踪,显示其特有的ID和运动轨迹。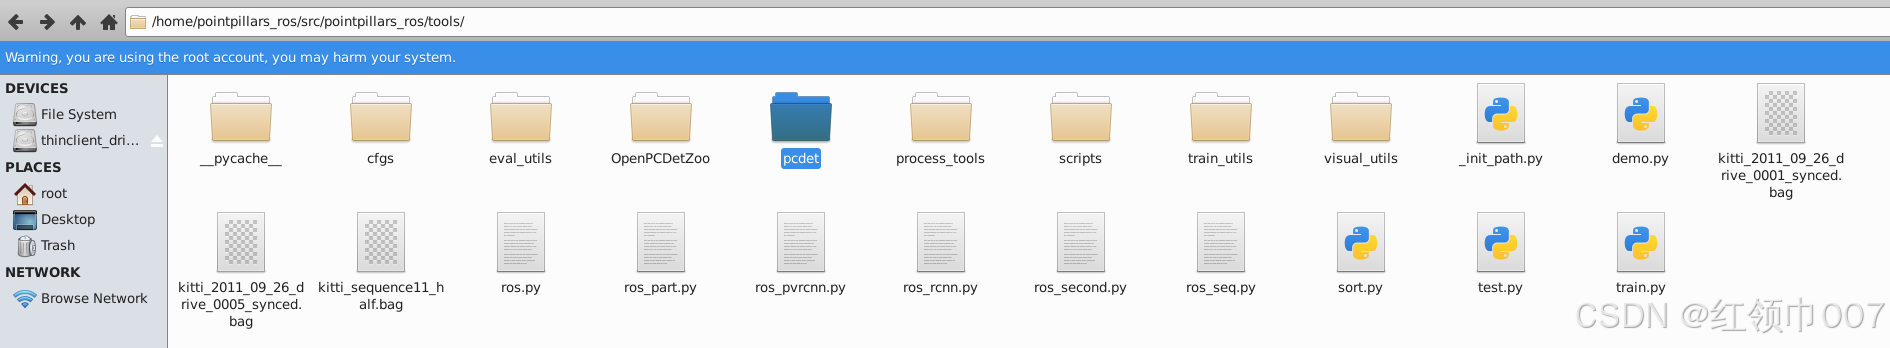
完整的工作目录如上所示,其中OpenPCDetZoo里放的是各个预训练的模型pth文件,可以再OpenPCDet的git代码中找到,3个rosbag用于测试,sort.py是用于追踪的代码,其余的文件结构可以在检测任务复现里得到,具体可以看下面指出的那篇文章。
1.三维场景下检测任务
这篇文章基本上解决了ros下开发kitti数据集的检测任务,首先需要实现检测任务。
三维目标检测之ROS可视化
这里的ros环境没有特别要求,网上还有一键无脑安装ros的插件,可以自行寻找。
-
唯一可能遇到的安装问题就是spconv安装,我是用的2.x版本,它和1.x的区别在于有几处代码需要修改(具体的可以看网上其他的资料)。
-
加速检测的方法:利用前面文章的方法进行复现可能会遇到检测框和点云不能实时匹配的问题,这是因为其中处理点云的函数得到的是list,将list转换为array这一步会有巨大延时,因此我修改了这一部分代码。首先安装rosnumpy库,然后找到合适的位置修改lidar_callback()
  `def lidar_callback(self, msg):
  """ Captures pointcloud data and feed into second model for inference """
  call_time = time.time()
  # pcl_msg = pc2.read_points(msg, skip_nans=True, field_names=("x", "y", "z","intensity","ring"))
  # np_p = np.array(list(pcl_msg), dtype=np.float32)
  np_p = ros_numpy.point_cloud2.pointcloud2_to_xyz_array(msg)
  # np_p = ros_numpy.point_cloud2.pointcloud2_to_array(msg)
  # np_p = np_p[['x','y','z']].view(np.float32)
  print('np shape',np_p.shape)
  # # 旋转轴
  # rand_axis = [0,1,0]
  # #旋转角度0.1047
  # yaw = 0
  # #返回旋转矩阵
  # rot_matrix = self.rotate_mat(rand_axis, yaw)
  # np_p_rot = np.dot(rot_matrix, np_p[:,:3].T).T# convert to xyzi point cloud
  # x = np_p['x'].reshape(-1)
  # y = np_p['y'].reshape(-1)
  # z = np_p['z'].reshape(-1)
  i = np.zeros((np_p.shape[0], 1)).reshape(-1)
  x = np_p[:, 0].reshape(-1)
  y = np_p[:, 1].reshape(-1)
  z = np_p[:, 2].reshape(-1)
  # if np_p.shape[1] == 4: # if intensity field exists
  #     i = np_p[:, 3].reshape(-1)
  # else:
  #     i = np.zeros((np_p.shape[0], 1)).reshape(-1)
  points = np.stack((x, y, z, i)).T
  print(points.shape)`
这里直接从消息读取点云,ros_numpy.point_cloud2.pointcloud2_to_xyz_array(msg)和ros_numpy.point_cloud2.pointcloud2_to_array(msg)都可以,但是后者速度更快。
2.三维场景下追踪任务
2.1 sort算法
- 谈到sort算法,首先想到的是卡尔曼滤波和匈牙利匹配算法,在网上看了其他文章都是实现的2D算法,基本上没什么人研究3d了。有兴趣研究原理的可以看这两篇文章
blog
【目标跟踪】多目标跟踪sort (python 代码) - 对于3d场景下的sort算法研究,可以参考的有AB3DMOT和一篇硕士论文,链接分别如下
AB3DMOT
硕士论文3d-lidar tracking
其中硕士论文的解释和说明更详细,因此算法原理部分我不在赘述,毕竟不是需要特别理解。
2.2 sort算法的实现
我是根据2d场景下的代码即第二篇文章的代码,然后通过gpt进行修改的(修改后的也不能直接使用)。虽然我后面发现了OpenPCdet实际上早就实现了一些组件,可以很好的简化这个问题。
我先直接贴出sort代码的实现,即sort.py, 如果你有仔细看这篇blog,你会发现他的结构确实跟第二篇sort算法原理文章相似。
import numpy as np
from scipy.optimize import linear_sum_assignment
from filterpy.kalman import KalmanFilter
import rospy
from visualization_msgs.msg import Marker
from geometry_msgs.msg import Point
from std_msgs.msg import ColorRGBA

def linear_assignment(cost_matrix):
    try:
        import lap
        _, x, y = lap.lapjv(cost_matrix, extend_cost=True)
        return np.array([[y[i], i] for i in x if i >= 0])
    except ImportError:
        from scipy.optimize import linear_sum_assignment
        x, y = linear_sum_assignment(cost_matrix)
        return np.array(list(zip(x, y)))

def iou_batch_3d(bb_test, bb_gt):
    bb_gt = np.expand_dims(bb_gt, 0)  # 转换为[1, B, 7]形状
    bb_test = np.expand_dims(bb_test, 1)  # 转换为[A, 1, 7]形状

    print('bb_test',bb_test.shape)
    print('bb_gt',bb_gt.shape)
    # 计算每个维度的重叠部分
    x1 = np.maximum(bb_test[..., 0] - bb_test[..., 3] / 2, bb_gt[..., 0] - bb_gt[..., 3] / 2)
    y1 = np.maximum(bb_test[..., 1] - bb_test[..., 4] / 2, bb_gt[..., 1] - bb_gt[..., 4] / 2)
    z1 = np.maximum(bb_test[..., 2] - bb_test[..., 5] / 2, bb_gt[..., 2] - bb_gt[..., 5] / 2)
    print('x1, y1, z1',x1.shape, y1.shape, z1.shape)
    x2 = np.minimum(bb_test[..., 0] + bb_test[..., 3] / 2, bb_gt[..., 0] + bb_gt[..., 3] / 2)
    y2 = np.minimum(bb_test[..., 1] + bb_test[..., 4] / 2, bb_gt[..., 1] + bb_gt[..., 4] / 2)
    z2 = np.minimum(bb_test[..., 2] + bb_test[..., 5] / 2, bb_gt[..., 2] + bb_gt[..., 5] / 2)

    # 计算每个维度的重叠长度
    w_overlap = np.maximum(0., x2 - x1)
    l_overlap = np.maximum(0., y2 - y1)
    h_overlap = np.maximum(0., z2 - z1)
    print('w_overlap', w_overlap.shape)

    # 计算重叠体积
    overlap_volume = w_overlap * l_overlap * h_overlap
    print('overlap_volume', overlap_volume.shape)
    print('overlap_volume', overlap_volume)
    # 计算每个边界框的体积
    bb_test_volume = bb_test[..., 3] * bb_test[..., 4] * bb_test[..., 5]
    bb_gt_volume = bb_gt[..., 3] * bb_gt[..., 4] * bb_gt[..., 5]

    # 计算联合体积
    union_volume = bb_test_volume + bb_gt_volume - overlap_volume

    # 计算IoU
    iou = overlap_volume / union_volume

    return iou

class KalmanBoxTracker3D(object):
    count = 0

    def __init__(self, bbox):
        self.kf = KalmanFilter(dim_x=11, dim_z=7)  # Adjusted dimensions for 3D
        # State transition matrix
        self.kf.F = np.array([
            [1, 0, 0, 0, 0, 0, 0, 1, 0, 0, 0],  # u
            [0, 1, 0, 0, 0, 0, 0, 0, 1, 0, 0],  # v
            [0, 0, 1, 0, 0, 0, 0, 0, 0, 1, 0],  # w
            [0, 0, 0, 1, 0, 0, 0, 0, 0, 0, 0],  # l
            [0, 0, 0, 0, 1, 0, 0, 0, 0, 0, 0],  # w
            [0, 0, 0, 0, 0, 1, 0, 0, 0, 0, 0],  # h
            [0, 0, 0, 0, 0, 0 ,1, 0, 0, 0, 1],  # theta
            [0, 0, 0, 0, 0, 0 ,0, 1, 0, 0, 0],  # u'
            [0, 0, 0, 0, 0, 0, 0, 0, 1, 0, 0],  # v'
            [0, 0, 0, 0, 0, 0, 0, 0, 0, 1, 0],  # w'
            [0, 0, 0, 0, 0, 0, 0, 0, 0, 0, 1]   # theta'
        ])
        # Measurement function
        self.kf.H = np.array([
            [1, 0, 0, 0, 0, 0, 0, 0, 0, 0, 0],  # u
            [0, 1, 0, 0, 0, 0, 0, 0, 0, 0, 0],  # v
            [0, 0, 1, 0, 0, 0, 0, 0, 0, 0, 0],  # w
            [0, 0, 0, 1, 0, 0, 0, 0, 0, 0, 0],  # l
            [0, 0, 0, 0, 1, 0, 0, 0, 0, 0, 0],  # w
            [0, 0, 0, 0, 0, 1, 0, 0, 0, 0, 0],   # h
            [0, 0, 0, 0, 0, 0, 1, 0, 0, 0, 0]   # theta
        ])

        # self.kf.R[3:, 3:] *= 10.  # Increase measurement uncertainty for volume and ratio
        self.kf.P[7:, 7:] *= 1000.  # Increase initial state uncertainty for velocities and volume rate
        self.kf.P *= 10.
        self.kf.Q[7:, 7:] *= 0.01  # Process noise for the velocities and volume rate

        self.kf.x[:7] = self.convert_bbox_to_z(bbox)  # Initial state
        self.time_since_update = 0
        self.id = KalmanBoxTracker3D.count
        KalmanBoxTracker3D.count += 1
        self.history = []
        self.hits = 0
        self.hit_streak = 0
        self.age = 0

    def convert_bbox_to_z(self, bbox):
        # Convert a 3D bbox [cx, cy, cz, l, w, h] to state vector
        cx, cy, cz, l, w, h, theta = bbox


        return np.array([cx, cy, cz, l, w, h, theta]).reshape((7, 1))

    def update(self, bbox):
        self.time_since_update = 0
        self.history = []
        self.hits += 1
        self.hit_streak += 1
        self.kf.update(self.convert_bbox_to_z(bbox))

    def predict(self):
        # if ((self.kf.x[8] + self.kf.x[3]) <= 0):
        #     self.kf.x[8] *= 0.0  # Prevent negative volume
        # if self.kf.x[6] >= np.pi:
        #     self.kf.x[6] -= np.pi*2
        # if self.kf.x[6] <= np.pi:
        #     self.kf.x[6] += np.pi*2
        self.kf.predict()
        self.age += 1
        if (self.time_since_update > 0):
            self.hit_streak = 0
        self.time_since_update += 1
        self.history.append(self.convert_x_to_bbox(self.kf.x))
        return self.history[-1]

    def convert_x_to_bbox(self, x):
        # Convert state vector back to bbox
        cx, cy, cz, l, w, h, theta, _, _, _, _ = x.flatten()

        return np.array([cx, cy, cz, l, w, h, theta]).reshape((1, 7))

    def get_state(self):
        return self.convert_x_to_bbox(self.kf.x)

def associate_detections_to_trackers_3d(detections, trackers, iou_threshold=0.3):
    if (len(trackers) == 0):
        return np.empty((0, 2), dtype=int), np.arange(len(detections)), np.empty((0, 7), dtype=int)

    iou_matrix = iou_batch_3d(detections, trackers)
    # print('detections', detections.shape)
    # print('trackers', trackers.shape)
    print('iou_matrix shape', iou_matrix.shape)
    print('iou_matrix', iou_matrix)

    if min(iou_matrix.shape) > 0:
        a = (iou_matrix > iou_threshold).astype(np.int32)
        if a.sum(1).max() == 1 and a.sum(0).max() == 1:
            matched_indices = np.stack(np.where(a), axis=1)
        else:
            matched_indices = linear_assignment(-iou_matrix)
    else:
        matched_indices = np.empty(shape=(0, 2))

    unmatched_detections = []
    for d, det in enumerate(detections):
        if (d not in matched_indices[:, 0]):
            unmatched_detections.append(d)
    unmatched_trackers = []
    for t, trk in enumerate(trackers):
        if (t not in matched_indices[:, 1]):
            unmatched_trackers.append(t)

    matches = []
    for m in matched_indices:
        if (iou_matrix[m[0], m[1]] < iou_threshold):
            unmatched_detections.append(m[0])
            unmatched_trackers.append(m[1])
        else:
            matches.append(m.reshape(1, 2))
    if (len(matches) == 0):
        matches = np.empty((0, 2), dtype=int)
    else:
        matches = np.concatenate(matches, axis=0)

    return matches, np.array(unmatched_detections), np.array(unmatched_trackers)

class SORT3D(object):
    def __init__(self, max_age=1, min_hits=3, iou_threshold=0.3):
        self.max_age = max_age
        self.min_hits = min_hits
        self.iou_threshold = iou_threshold
        self.trackers = []
        self.frame_count = 0

    def update(self, dets=np.empty((0, 7))):
        self.frame_count += 1
        trks = np.zeros((len(self.trackers), 7))
        to_del = []
        ret = []
        for t, trk in enumerate(trks):
            pos = self.trackers[t].predict()[0]
            # print('pos',pos.shape)
            trk[:] = [pos[0], pos[1], pos[2], pos[3], pos[4], pos[5], pos[6]]
            if np.any(np.isnan(pos)):
                to_del.append(t)
        trks = np.ma.compress_rows(np.ma.masked_invalid(trks))
        for t in reversed(to_del):
            self.trackers.pop(t)

        matched, unmatched_dets, unmatched_trks = associate_detections_to_trackers_3d(dets, trks, self.iou_threshold)
        print('matched','unmatched_dets',matched,unmatched_dets)

        for m in matched:
            self.trackers[m[1]].update(dets[m[0], :])

        for i in unmatched_dets:
            trk = KalmanBoxTracker3D(dets[i, :])
            self.trackers.append(trk)
        i = len(self.trackers)
        for trk in reversed(self.trackers):
            d = trk.get_state()[0]
            if (trk.time_since_update < 1) and (trk.hit_streak >= self.min_hits or self.frame_count <= self.min_hits):
                ret.append(np.concatenate(([trk.id + 1], d)).reshape(1, -1))
            i -= 1
            if (trk.time_since_update > self.max_age):
                self.trackers.pop(i)
        if (len(ret) > 0):
            return np.concatenate(ret)
        return np.empty((0, 8))
对于这部分代码我简要说明一些原理:
- 卡尔曼滤波部分,对于转移矩阵11维和观测矩阵7维,前面的两篇3d算法实现都有自己的论述,我和他们也不尽相同。之前的3D检测部分得到的检测框结果可以整理为7个变量, [ x , y , z , l , w , h , t h e t a ] [x,y,z,l,w,h,theta] [x,y,z,l,w,h,theta],其中x,y,z代表坐标中心,l,w,h代表长宽高,theta代表位姿角度。转移矩阵考虑的速度有三个方向的坐标转移速率和位姿角度变化的速率,因此就是7+4=11个变量。
- 匈牙利匹配部分,具体实现在associate_detections_to_trackers_3d(),其中比较重要的部分在于iou计算的部分,即iou_batch_3d的实现。这里涉及到3d场景下的iou计算,如果是2d场景下的iou,我相信大多数人都能直接找到函数调用接口,由于我是ros领域的初学者,因此对3d iou计算不太清楚,感觉这可以是一个复杂问题,也可以是一个简化的问题。
2.2.1 3d场景下的iou计算
考虑两个立体框的交并比,由于3d场景下还有框的位姿角度问题,因此这可能比较复杂。通过gpt写了该函数以后,后来仔细想了想检测任务也应该有IOU计算模组,去翻他们代码,结果确实发现存在这些模组,在pcdet目录下找到/home/pointpillars_ros/src/pointpillars_ros/pcdet/ops/iou3d_nms/iou3d_nms_utils.py,其中有一些iou计算函数
比如:
 def boxes_iou3d_gpu(boxes_a, boxes_b):
    """
    Args:
        boxes_a: (N, 7) [x, y, z, dx, dy, dz, heading]
        boxes_b: (M, 7) [x, y, z, dx, dy, dz, heading]
    Returns:
        ans_iou: (N, M)
    """
还有bev(鸟瞰图)下的计算:
def boxes_iou_bev(boxes_a, boxes_b):
    """
    Args:
        boxes_a: (N, 7) [x, y, z, dx, dy, dz, heading]
        boxes_b: (M, 7) [x, y, z, dx, dy, dz, heading]

    Returns:
        ans_iou: (N, M)
    """
查看俩函数后,可以发现,两个函数是有关联的,3d函数实际上可以先通过计算bev下的iou后,再乘上高度重叠的长度,即可计算得到体积,这也是一种很好的实现方法。
IOU计算也还有其他计算形式,例如简化过后的欧式距离,即算两个框的中心距离,也还有忽略heading朝向,直接认为两框平行的计算(这种方法在高速转向的过程中不准确),即:
def iou_batch_3d(bb_test, bb_gt):
    bb_gt = np.expand_dims(bb_gt, 0)  # 转换为[1, B, 7]形状
    bb_test = np.expand_dims(bb_test, 1)  # 转换为[A, 1, 7]形状

    print('bb_test',bb_test.shape)
    print('bb_gt',bb_gt.shape)
    print('bb_test theta',bb_test[...,6])
    # 计算每个维度的重叠部分
    x1 = np.maximum(bb_test[..., 0] - bb_test[..., 3] / 2, bb_gt[..., 0] - bb_gt[..., 3] / 2)
    y1 = np.maximum(bb_test[..., 1] - bb_test[..., 4] / 2, bb_gt[..., 1] - bb_gt[..., 4] / 2)
    z1 = np.maximum(bb_test[..., 2] - bb_test[..., 5] / 2, bb_gt[..., 2] - bb_gt[..., 5] / 2)
    print('x1, y1, z1',x1.shape, y1.shape, z1.shape)
    x2 = np.minimum(bb_test[..., 0] + bb_test[..., 3] / 2, bb_gt[..., 0] + bb_gt[..., 3] / 2)
    y2 = np.minimum(bb_test[..., 1] + bb_test[..., 4] / 2, bb_gt[..., 1] + bb_gt[..., 4] / 2)
    z2 = np.minimum(bb_test[..., 2] + bb_test[..., 5] / 2, bb_gt[..., 2] + bb_gt[..., 5] / 2)

    # 计算每个维度的重叠长度
    w_overlap = np.maximum(0., x2 - x1)
    l_overlap = np.maximum(0., y2 - y1)
    h_overlap = np.maximum(0., z2 - z1)
    print('w_overlap', w_overlap.shape)

    # 计算重叠体积
    overlap_volume = w_overlap * l_overlap * h_overlap
    print('overlap_volume', overlap_volume.shape)
    print('overlap_volume', overlap_volume)
    # 计算每个边界框的体积
    bb_test_volume = bb_test[..., 3] * bb_test[..., 4] * bb_test[..., 5]
    bb_gt_volume = bb_gt[..., 3] * bb_gt[..., 4] * bb_gt[..., 5]

    # 计算联合体积
    union_volume = bb_test_volume + bb_gt_volume - overlap_volume

    # 计算IoU
    iou = overlap_volume / union_volume

    return iou
代码具体解释我就不多说了,可以自行print出各个变量和问gpt各条操作的含义就明白了。
2.3 ros追踪部分可视化的实现
以性能更好的second模型为例,修改ros.py,新建一个名为ros_second.py文件,相应的你还可以新写一个rviz文件和launch文件。如下图所示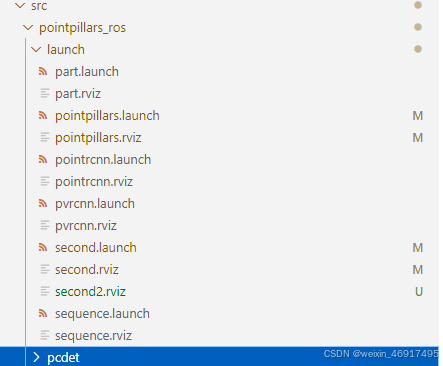
second.launch内容如下,其中rosbag的获得自行查阅资料如何获得(大概是从kitti官网上下载几个文件,本地编译一下,网上一抓一大把教程,不多赘述)
后续补充:为了方便测试,我还是给出了rosbag
链接
<launch>
  <node pkg="rosbag" type="play" name="player" output="log" args="-l -r 0.5 /home/pointpillars_ros/src/pointpillars_ros/tools/kitti_2011_09_26_drive_0005_synced.bag" />
  <node name="second_ros" type="ros_second.py" pkg="pointpillars_ros" output="screen"/>
  <node type="rviz" name="rviz" pkg="rviz" args="-d $(find pointpillars_ros)/launch/second2.rviz" />
</launch>
rviz文件根据个人喜好修改,这是为了方便复现结果设置的,你在自己的rviz里添加好各个内容后再点左上角file便能保存参数。
具体内容如下:
Panels:
  - Class: rviz/Displays
    Help Height: 78
    Name: Displays
    Property Tree Widget:
      Expanded:
        - /Global Options1
        - /Status1
        - /PointCloud21
        - /BoundingBoxArray1
        - /MarkerArray1
        - /MarkerArray2
      Splitter Ratio: 0.5
    Tree Height: 239
  - Class: rviz/Selection
    Name: Selection
  - Class: rviz/Tool Properties
    Expanded:
      - /2D Pose Estimate1
      - /2D Nav Goal1
      - /Publish Point1
    Name: Tool Properties
    Splitter Ratio: 0.5886790156364441
  - Class: rviz/Views
    Expanded:
      - /Current View1
    Name: Views
    Splitter Ratio: 0.5
  - Class: rviz/Time
    Name: Time
    SyncMode: 0
    SyncSource: PointCloud2
Preferences:
  PromptSaveOnExit: true
Toolbars:
  toolButtonStyle: 2
Visualization Manager:
  Class: ""
  Displays:
    - Alpha: 0.5
      Cell Size: 1
      Class: rviz/Grid
      Color: 160; 160; 164
      Enabled: true
      Line Style:
        Line Width: 0.029999999329447746
        Value: Lines
      Name: Grid
      Normal Cell Count: 0
      Offset:
        X: 0
        Y: 0
        Z: 0
      Plane: XY
      Plane Cell Count: 10
      Reference Frame: <Fixed Frame>
      Value: true
    - Alpha: 1
      Autocompute Intensity Bounds: true
      Autocompute Value Bounds:
        Max Value: 26.235191345214844
        Min Value: -12.199440002441406
        Value: true
      Axis: Z
      Channel Name: intensity
      Class: rviz/PointCloud2
      Color: 255; 255; 255
      Color Transformer: FlatColor
      Decay Time: 0
      Enabled: true
      Invert Rainbow: false
      Max Color: 255; 255; 255
      Min Color: 0; 0; 0
      Name: PointCloud2
      Position Transformer: XYZ
      Queue Size: 10
      Selectable: true
      Size (Pixels): 3
      Size (m): 0.05000000074505806
      Style: Squares
      Topic: /kitti/velo/pointcloud
      Unreliable: false
      Use Fixed Frame: true
      Use rainbow: true
      Value: true
    - Alpha: 1
      Class: rviz/Axes
      Enabled: true
      Length: 1
      Name: Axes
      Radius: 0.10000000149011612
      Reference Frame: <Fixed Frame>
      Show Trail: false
      Value: true
    - Class: jsk_rviz_plugin/BoundingBoxArray
      Enabled: true
      Name: BoundingBoxArray
      Queue Size: 10
      Topic: /detections
      Unreliable: false
      Value: true
      alpha: 0.800000011920929
      alpha max: 1
      alpha method: flat
      alpha min: 0
      color: 25; 255; 0
      coloring: Flat color
      line width: 0.20000000298023224
      only edge: true
      show coords: false
      value threshold: 0
    - Class: rviz/MarkerArray
      Enabled: true
      Marker Topic: /visualization_history_array
      Name: MarkerArray
      Namespaces:
        history_objects: true
      Queue Size: 10
      Value: true
    - Class: rviz/MarkerArray
      Enabled: true
      Marker Topic: visualization_marker_array
      Name: MarkerArray
      Namespaces:
        tracked_objects: true
        tracked_objects_text: true
      Queue Size: 10
      Value: true
    - Class: rviz/Image
      Enabled: true
      Image Topic: /kitti/camera_color_left/image_raw
      Max Value: 1
      Median window: 5
      Min Value: 0
      Name: Image
      Normalize Range: true
      Queue Size: 2
      Transport Hint: raw
      Unreliable: false
      Value: true
  Enabled: true
  Global Options:
    Background Color: 48; 48; 48
    Default Light: true
    Fixed Frame: velo_link
    Frame Rate: 30
  Name: root
  Tools:
    - Class: rviz/Interact
      Hide Inactive Objects: true
    - Class: rviz/MoveCamera
    - Class: rviz/Select
    - Class: rviz/FocusCamera
    - Class: rviz/Measure
    - Class: rviz/SetInitialPose
      Theta std deviation: 0.2617993950843811
      Topic: /initialpose
      X std deviation: 0.5
      Y std deviation: 0.5
    - Class: rviz/SetGoal
      Topic: /move_base_simple/goal
    - Class: rviz/PublishPoint
      Single click: true
      Topic: /clicked_point
  Value: true
  Views:
    Current:
      Class: rviz/Orbit
      Distance: 61.30393600463867
      Enable Stereo Rendering:
        Stereo Eye Separation: 0.05999999865889549
        Stereo Focal Distance: 1
        Swap Stereo Eyes: false
        Value: false
      Field of View: 0.7853981852531433
      Focal Point:
        X: 11.016645431518555
        Y: -6.342355728149414
        Z: 3.211975574493408
      Focal Shape Fixed Size: true
      Focal Shape Size: 0.05000000074505806
      Invert Z Axis: false
      Name: Current View
      Near Clip Distance: 0.009999999776482582
      Pitch: 1.124796748161316
      Target Frame: <Fixed Frame>
      Yaw: 3.210404872894287
    Saved: ~
Window Geometry:
  Displays:
    collapsed: false
  Height: 1011
  Hide Left Dock: false
  Hide Right Dock: false
  Image:
    collapsed: false
  QMainWindow State: 000000ff00000000fd00000004000000000000031400000358fc0200000009fb0000001200530065006c0065006300740069006f006e00000001e10000009b0000005c00fffffffb0000001e0054006f006f006c002000500072006f007000650072007400690065007302000001ed000001df00000185000000a3fb000000120056006900650077007300200054006f006f02000001df000002110000018500000122fb000000200054006f006f006c002000500072006f0070006500720074006900650073003203000002880000011d000002210000017afb000000100044006900730070006c006100790073010000003b00000178000000c700fffffffb0000002000730065006c0065006300740069006f006e00200062007500660066006500720200000138000000aa0000023a00000294fb00000014005700690064006500530074006500720065006f02000000e6000000d2000003ee0000030bfb0000000c004b0069006e0065006300740200000186000001060000030c00000261fb0000000a0049006d00610067006501000001b9000001da0000001600ffffff000000010000010f00000354fc0200000003fb0000001e0054006f006f006c002000500072006f00700065007200740069006500730100000041000000780000000000000000fb0000000a00560069006500770073000000003d00000354000000a000fffffffb0000001200530065006c0065006300740069006f006e010000025a000000b200000000000000000000000200000490000000a9fc0100000001fb0000000a00560069006500770073030000004e00000080000002e10000019700000003000007760000003ffc0100000002fb0000000800540069006d00650100000000000007760000030700fffffffb0000000800540069006d006501000000000000045000000000000000000000045c0000035800000004000000040000000800000008fc0000000100000002000000010000000a0054006f006f006c00730100000000ffffffff0000000000000000
  Selection:
    collapsed: false
  Time:
    collapsed: false
  Tool Properties:
    collapsed: false
  Views:
    collapsed: false
  Width: 1910
  X: 0
  Y: 27
再给出新修改的ros代码,ros_second.py
import rospy
from sensor_msgs.msg import PointCloud2
import sensor_msgs.point_cloud2 as pc2
from std_msgs.msg import Header
from jsk_recognition_msgs.msg import BoundingBox, BoundingBoxArray
from visualization_msgs.msg import Marker, MarkerArray
import ros_numpy

import time
import numpy as np
from pyquaternion import Quaternion

import argparse
import glob
from pathlib import Path

import mayavi.mlab as mlab
import numpy as np
import torch
import scipy.linalg as linalg

import sys
sys.path.append("/home/pointpillars_ros/src/pointpillars_ros")

from pcdet.config import cfg, cfg_from_yaml_file
from pcdet.datasets import DatasetTemplate
from pcdet.models import build_network, load_data_to_gpu
from pcdet.utils import common_utils
from sort import SORT3D
from geometry_msgs.msg import Point
from std_msgs.msg import ColorRGBA

class DemoDataset(DatasetTemplate):
    def __init__(self, dataset_cfg, class_names, training=True, root_path=None, logger=None, ext='.bin'):
        """
        Args:
            root_path: 根目录
            dataset_cfg: 数据集配置
            class_names: 类别名称
            training: 训练模式
            logger: 日志
            ext: 扩展名
        """
        super().__init__(
            dataset_cfg=dataset_cfg, class_names=class_names, training=training, root_path=root_path, logger=logger
        )


class Pointpillars_ROS:
    def __init__(self):
        config_path, ckpt_path = self.init_ros()
        self.init_pointpillars(config_path, ckpt_path)
        self.sort3d_tracker = SORT3D(max_age=3, min_hits=3)
        self.last_time = time.time()
        # print("init ros")
        self.frame_count = 0
        self.fps = 0
        self.total_frames = 0
        # self.prev_bboxes= {}
        # self.prev_time = None
        self.total_preprocess_time = 0
        self.total_inference_time = 0
        self.total_time_elapsed = 0


    def init_ros(self):
        """ Initialize ros parameters """
        config_path = rospy.get_param("/config_path", "/home/pointpillars_ros/src/pointpillars_ros/tools/cfgs/kitti_models/second.yaml")
        ckpt_path = rospy.get_param("/ckpt_path", "/home/pointpillars_ros/src/pointpillars_ros/tools/OpenPCDetZoo/second_7862.pth")
        self.sub_velo = rospy.Subscriber("/kitti/velo/pointcloud", PointCloud2, self.lidar_callback, queue_size=2,  buff_size=2**12)
        self.pub_bbox = rospy.Publisher("/detections", BoundingBoxArray, queue_size=2)
        # self.pub_marker = rospy.Publisher('/visualization_Marker', MarkerArray, queue_size=1)
        self.marker_pub = rospy.Publisher('/visualization_marker_array', MarkerArray, queue_size=2)
        print(ckpt_path)
        return config_path, ckpt_path


    def init_pointpillars(self, config_path, ckpt_path):
        """ Initialize second model """
        logger = common_utils.create_logger() # 创建日志
        logger.info('-----------------Quick Demo of Pointpillars-------------------------')
        cfg_from_yaml_file(config_path, cfg)  # 加载配置文件

        self.demo_dataset = DemoDataset(
            dataset_cfg=cfg.DATA_CONFIG, class_names=cfg.CLASS_NAMES, training=False,
            ext='.bin', logger=logger
        )
        self.model = build_network(model_cfg=cfg.MODEL, num_class=len(cfg.CLASS_NAMES), dataset=self.demo_dataset)
        # 加载权重文件
        self.model.load_params_from_file(filename=ckpt_path, logger=logger, to_cpu=True)
        self.model.cuda() # 将网络放到GPU上
        self.model.eval() # 开启评估模式


    def rotate_mat(self, axis, radian):
        rot_matrix = linalg.expm(np.cross(np.eye(3), axis / linalg.norm(axis) * radian))
        return rot_matrix

    def lidar_callback(self, msg):
        """ Captures pointcloud data and feed into second model for inference """
        call_time = time.time()
        # pcl_msg = pc2.read_points(msg, skip_nans=True, field_names=("x", "y", "z","intensity","ring"))
        # np_p = np.array(list(pcl_msg), dtype=np.float32)
        np_p = ros_numpy.point_cloud2.pointcloud2_to_xyz_array(msg)
        # np_p = ros_numpy.point_cloud2.pointcloud2_to_array(msg)
        # np_p = np_p[['x','y','z']].view(np.float32)
        print('np shape',np_p.shape)
        # # 旋转轴
        # rand_axis = [0,1,0]
        # #旋转角度0.1047
        # yaw = 0
        # #返回旋转矩阵
        # rot_matrix = self.rotate_mat(rand_axis, yaw)
        # np_p_rot = np.dot(rot_matrix, np_p[:,:3].T).T

        # convert to xyzi point cloud
        # x = np_p['x'].reshape(-1)
        # y = np_p['y'].reshape(-1)
        # z = np_p['z'].reshape(-1)
        i = np.zeros((np_p.shape[0], 1)).reshape(-1)
        x = np_p[:, 0].reshape(-1)
        y = np_p[:, 1].reshape(-1)
        z = np_p[:, 2].reshape(-1)
        # if np_p.shape[1] == 4: # if intensity field exists
        #     i = np_p[:, 3].reshape(-1)
        # else:
        #     i = np.zeros((np_p.shape[0], 1)).reshape(-1)
        points = np.stack((x, y, z, i)).T
        print(points.shape)
        # 组装数组字典
        input_dict = {
            'points': points,
            'frame_id': 0,
        }
        data_dict = self.demo_dataset.prepare_data(data_dict=input_dict) # 数据预处理
        data_dict = self.demo_dataset.collate_batch([data_dict])
        load_data_to_gpu(data_dict) # 将数据放到GPU上
        preprocess_end_time = time.time()
        preprocess_time = preprocess_end_time - call_time
        self.total_preprocess_time += preprocess_time  # 累加数据处理时间


        #inference time
        start_time = time.time()
        pred_dicts, _ = self.model.forward(data_dict) # 模型前向传播
        end_time = time.time()
        inference_time = end_time-start_time
        self.total_inference_time += inference_time  # 累加推理时间
        self.frame_count += 1

        #calculate FPS
        call_end_time = time.time()
        time_elapsed = call_end_time - call_time

        self.total_time_elapsed += time_elapsed  # 累计总时间
        self.total_frames += 1 # 累加 FPS
        # 每1秒输出一次平均数据
        if self.total_frames > 0 and call_end_time - self.last_time >= 1.0:
            avg_preprocess_time = self.total_preprocess_time / self.total_frames
            avg_inference_time = self.total_inference_time / self.total_frames
            avg_fps = self.total_frames / self.total_time_elapsed

            rospy.loginfo("Average Processing Time: %.4f seconds, Average Inference Time: %.4f seconds, Average FPS: %.2f", avg_preprocess_time, avg_inference_time, avg_fps)

            self.last_time = call_end_time
            # 重置计数器
            self.total_preprocess_time = 0.0
            self.total_inference_time = 0.0
            self.total_time_elapsed  = 0.0
            self.total_frames = 0

        scores = pred_dicts[0]['pred_scores'].detach().cpu().numpy()
        mask = scores>0.5
        scores = scores[mask]
        boxes_lidar = pred_dicts[0]['pred_boxes'][mask].detach().cpu().numpy()
        label = pred_dicts[0]['pred_labels'][mask].detach().cpu().numpy()
        num_detections = boxes_lidar.shape[0]
        rospy.loginfo("The num is: %d ", num_detections)

        # print(boxes_lidar)
        # print(scores)
        print('label',label)

        # calculate speed
        # current_time = time.time()
        # _time = current_time - self.prev_time if self.prev_time else 0.1

        # 更新SORT3D跟踪器
        # print('box lidar',boxes_lidar.shape)
        tracked_objects = self.sort3d_tracker.update(boxes_lidar)
        if len(tracked_objects)>0 :
            print('tracked objects', tracked_objects.shape)
            # Visualize the results in RViz
            self.visualize(tracked_objects)

        box_time = time.time()
        arr_bbox = BoundingBoxArray()
        # marker_arr = MarkerArray()
        for i in range(num_detections):
            bbox = BoundingBox()

            bbox.header.frame_id = msg.header.frame_id
            bbox.header.stamp = rospy.Time.now()
            bbox.pose.position.x = float(boxes_lidar[i][0])
            bbox.pose.position.y = float(boxes_lidar[i][1])
            bbox.pose.position.z = float(boxes_lidar[i][2]) + float(boxes_lidar[i][5]) / 2
            bbox.dimensions.x = float(boxes_lidar[i][3])  # width
            bbox.dimensions.y = float(boxes_lidar[i][4])  # length
            bbox.dimensions.z = float(boxes_lidar[i][5])  # height
            q = Quaternion(axis=(0, 0, 1), radians=float(boxes_lidar[i][6]))
            bbox.pose.orientation.x = q.x
            bbox.pose.orientation.y = q.y
            bbox.pose.orientation.z = q.z
            bbox.pose.orientation.w = q.w
            bbox.value = scores[i]
            bbox.label = label[i]

            arr_bbox.boxes.append(bbox)

        arr_bbox.header.frame_id = msg.header.frame_id
        arr_bbox.header.stamp = rospy.Time.now()

        # update time
        # self.prev_time = current_time
        rospy.loginfo("boundingbox time: %.4f", time.time()-call_time)

        self.pub_bbox.publish(arr_bbox)

        # self.pub_marker.publish(marker_arr)

    def clear_markers(self):
        # 创建一个MarkerArray消息,用于删除所有旧的标记
        clear_marker = MarkerArray()
        marker = Marker()
        marker.action = Marker.DELETEALL
        clear_marker.markers.append(marker)
        self.marker_pub.publish(clear_marker)

    def visualize(self, tracked_objects):
        self.clear_markers()
        marker_array = MarkerArray()
        for obj in tracked_objects:
            # 创建立方体标记
            cube_marker = Marker()
            cube_marker.header.frame_id = "velo_link"
            cube_marker.header.stamp = rospy.Time.now()
            cube_marker.ns = "tracked_objects"
            cube_marker.id = int(obj[0])
            cube_marker.type = Marker.CUBE
            cube_marker.action = Marker.ADD
            cube_marker.pose.position = Point(obj[1], obj[2], obj[3])
            q = Quaternion(axis=(0, 0, 1), radians=float(obj[7]))
            cube_marker.pose.orientation.x = q.x
            cube_marker.pose.orientation.y = q.y
            cube_marker.pose.orientation.z = q.z
            cube_marker.pose.orientation.w = q.w
            cube_marker.scale.x = obj[4]
            cube_marker.scale.y = obj[5]
            cube_marker.scale.z = obj[6]
            cube_marker.color = ColorRGBA(0, 1, 0, 1)  # Green color for tracked objects
            marker_array.markers.append(cube_marker)

            # 创建文本标记
            text_marker = Marker()
            text_marker.header.frame_id = "velo_link"
            text_marker.header.stamp = rospy.Time.now()
            text_marker.ns = "tracked_objects_text"
            text_marker.id = int(obj[0]) + 1000  # 确保文本标记的 ID 不与立方体标记冲突
            text_marker.type = Marker.TEXT_VIEW_FACING
            text_marker.action = Marker.ADD
            text_marker.pose.position = Point(obj[1]+obj[4]/2, obj[2]+obj[5]/2, obj[3] + obj[6]/2)  # 将文本稍微提高以避免与立方体重叠
            text_marker.scale.z = 2  # 设置文本大小
            text_marker.color = ColorRGBA(1, 1, 1, 1)  # White color for text
            text_marker.text = f"ID: {int(obj[0])}"
            marker_array.markers.append(text_marker)

            # 发布文本标记
        self.marker_pub.publish(marker_array)


if __name__ == '__main__':
    sec = Pointpillars_ROS()
    rospy.init_node('pointpillars_ros_node', anonymous=True)
    try:
        rospy.spin()
    except KeyboardInterrupt:
        del sec
        print("Shutting down")
可视化内容主要新增了1个框的追踪,并显示其id,我推荐使用openpcdet的iou检测函数进行替换,效果应该更好。
简单两行替换原有iou_batch_3d的使用(匈牙利匹配函数里)
iou_matrix = iou_batch_3d(detections, trackers)
替换为
    device = torch.device("cuda")
    iou_matrix = iou3d_nms_utils.boxes_iou3d_gpu(torch.tensor(detections).float().to(device), torch.tensor(trackers).float().to(device)).cpu().numpy()
3 ROS可视化结果展示
在ubuntu系统上启动ros节点后,打开终端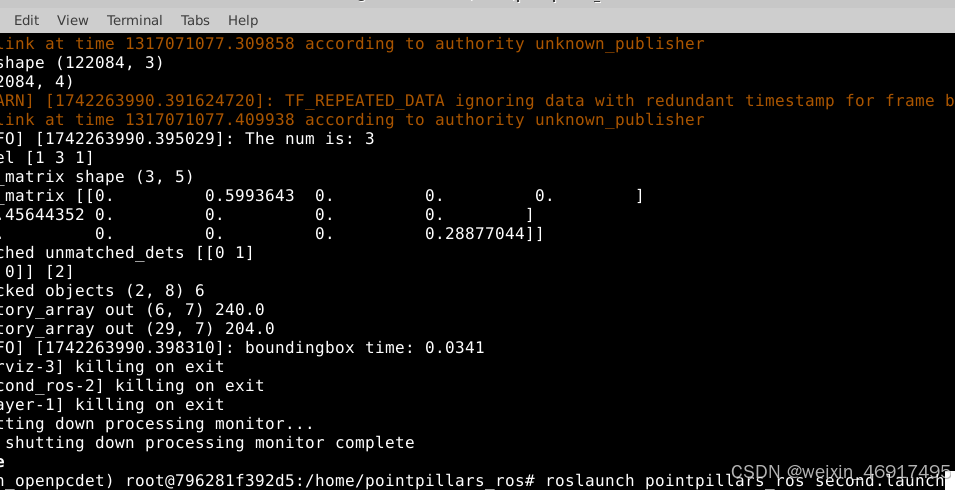
得到rviz完整界面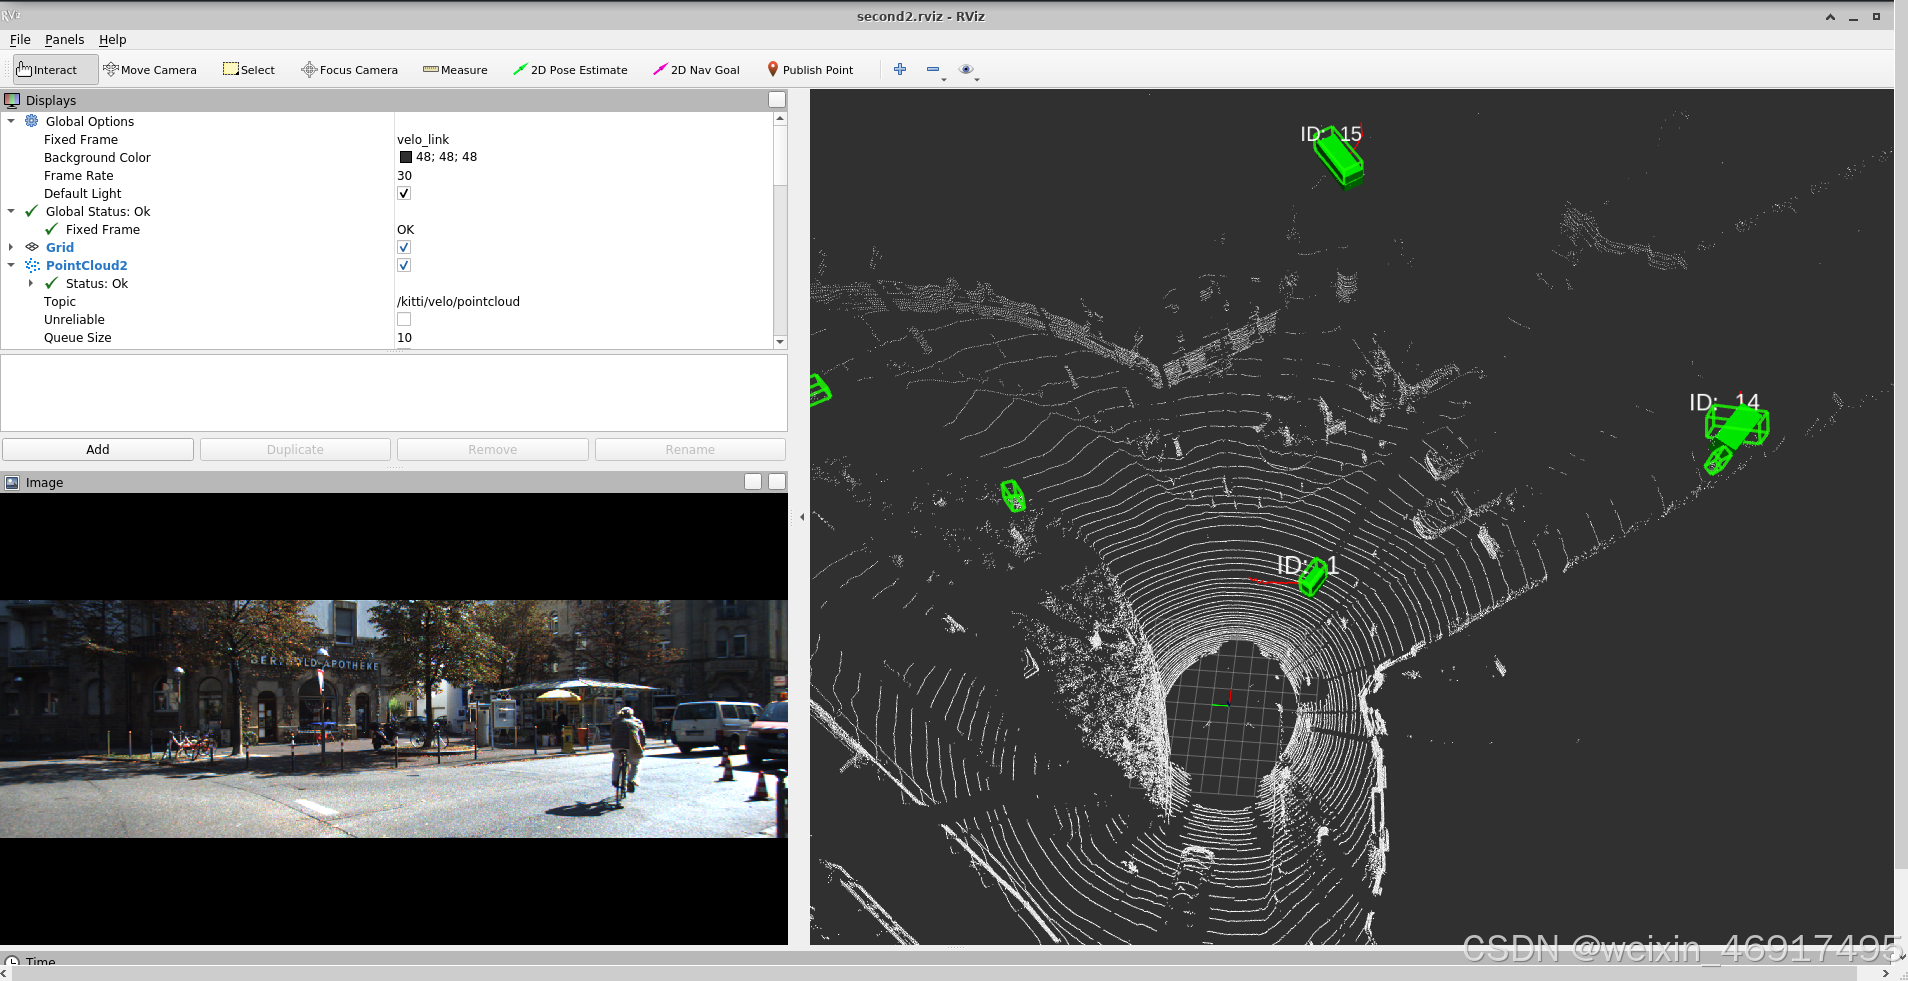
这里对于初学者可能不知道rviz界面如何使用,如果不复制前面的rviz文件,你可能需要自行左侧add新的类,如boundingboxarray等等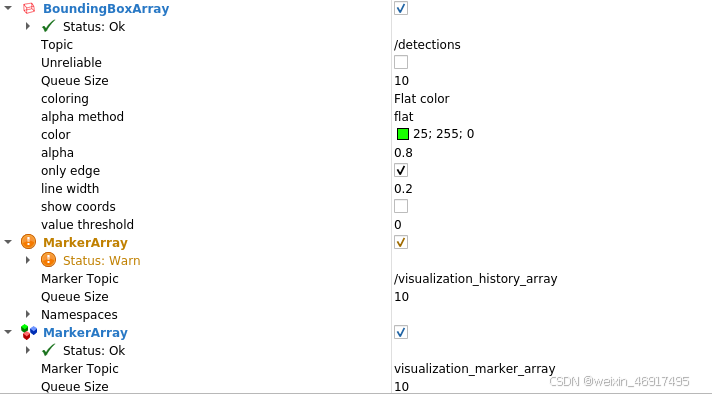
上面贴出的代码应该只有detections和visualization_marker_array的实现,而history是我后来实现的历史轨迹的可视化(如果感兴趣的人多的话,我以后再给出代码).
最终的ROS可视化结果我保存成了一张GIF,链接如下ROS追踪,或者直接看视频
20250318_152625
其中绿色方框是检测框,实心绿色立方体是追踪目标,筛选追踪目标可以根据max_age和min_hits来控制,从结果可以看到并不是所有的检测框都有追踪,而且目标丢失几帧也不一定会导致目标跟丢。图中的红色实线是历史轨迹跟踪,以后再贴代码。

魔乐社区(Modelers.cn) 是一个中立、公益的人工智能社区,提供人工智能工具、模型、数据的托管、展示与应用协同服务,为人工智能开发及爱好者搭建开放的学习交流平台。社区通过理事会方式运作,由全产业链共同建设、共同运营、共同享有,推动国产AI生态繁荣发展。
更多推荐


 9
9 0
0- 0


 已为社区贡献1条内容

所有评论(0)