matlab中 text 使用画图示例
% Plot the image of the Sensitivity and False Positive per imageclear;close all;clc;I1 =[0.5 75];I2 =[1 54.5];msize =19; %设定字体的大小hold onplot(I1(1),I1(2),'ko-','MarkerFaceColor','r')% 红色实心圆点
·
% Plot the image of the Sensitivity and False Positive per image
clear;
close all;
clc;
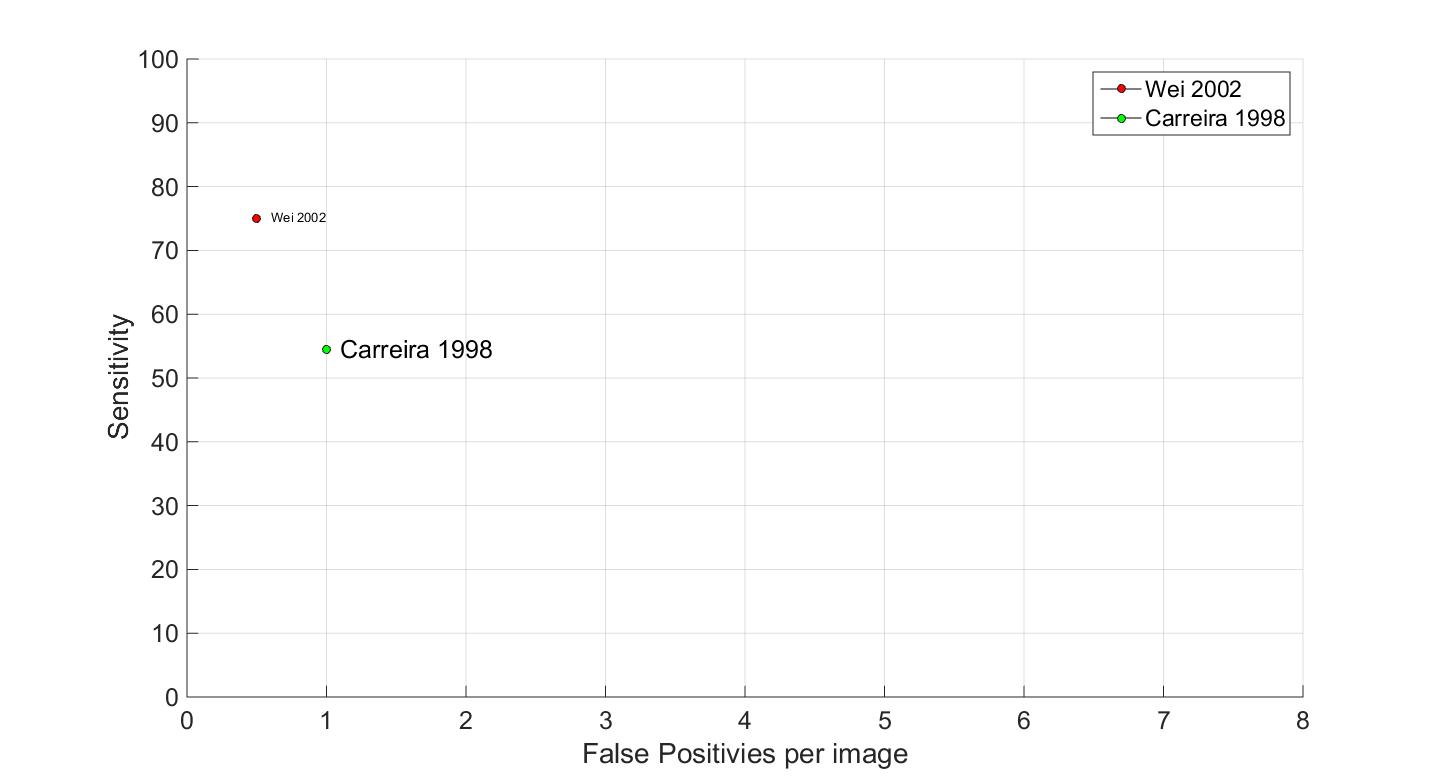
I1 =[0.5 75];
I2 =[1 54.5];
msize =19; %设定字体的大小
hold on
plot(I1(1),I1(2),'ko-','MarkerFaceColor','r') % 红色实心圆点
text(I1(1)+0.1,I1(2),'Wei 2002')
hold on
plot(I2(1),I2(2),'ko-','MarkerFaceColor','g') % 绿色实心圆点
text(I2(1)+0.1,I2(2),'Carreira 1998','fontsize',msize)
hold on
legend('Wei 2002','Carreira 1998')
axis on;
axis tight
grid on
axis([0 8 0 100]);
ylabel('Sensitivity')
xlabel('False Positivies per image')
% 用set设定绘图坐标的FontSize属性,这种设定同时对坐标轴标注、图例、标题有效
h = gca;
set(h,'FontSize',msize);% 设置文字大小,同时影响坐标轴标注、图例、标题等
% x=0:0.2:12;
% plot(x,sin(x),'-',x,1.5*cos(x),':')
% legend('First','Second',-1); %强行将注释视窗放在图形视窗的外右边。
效果图如下

魔乐社区(Modelers.cn) 是一个中立、公益的人工智能社区,提供人工智能工具、模型、数据的托管、展示与应用协同服务,为人工智能开发及爱好者搭建开放的学习交流平台。社区通过理事会方式运作,由全产业链共同建设、共同运营、共同享有,推动国产AI生态繁荣发展。
更多推荐


 4
4 0
0- 0


 已为社区贡献2条内容

所有评论(0)