ICESat-2卫星数据处理
【代码】ICESat-2卫星数据处理。
·
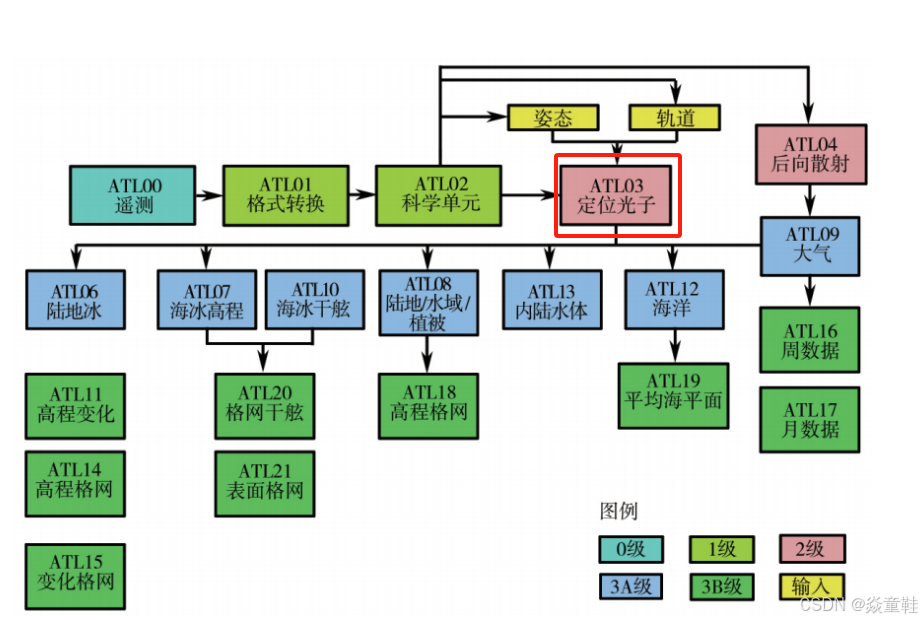
ICESat-2卫星是美国宇航局(NASA)的一颗卫星,旨在测量地球的冰盖、云层和陆地的高程。ATL08数据产品专注于测量地表高程和植被的高度,主要用于研究森林、草地和冰川等地表特征。
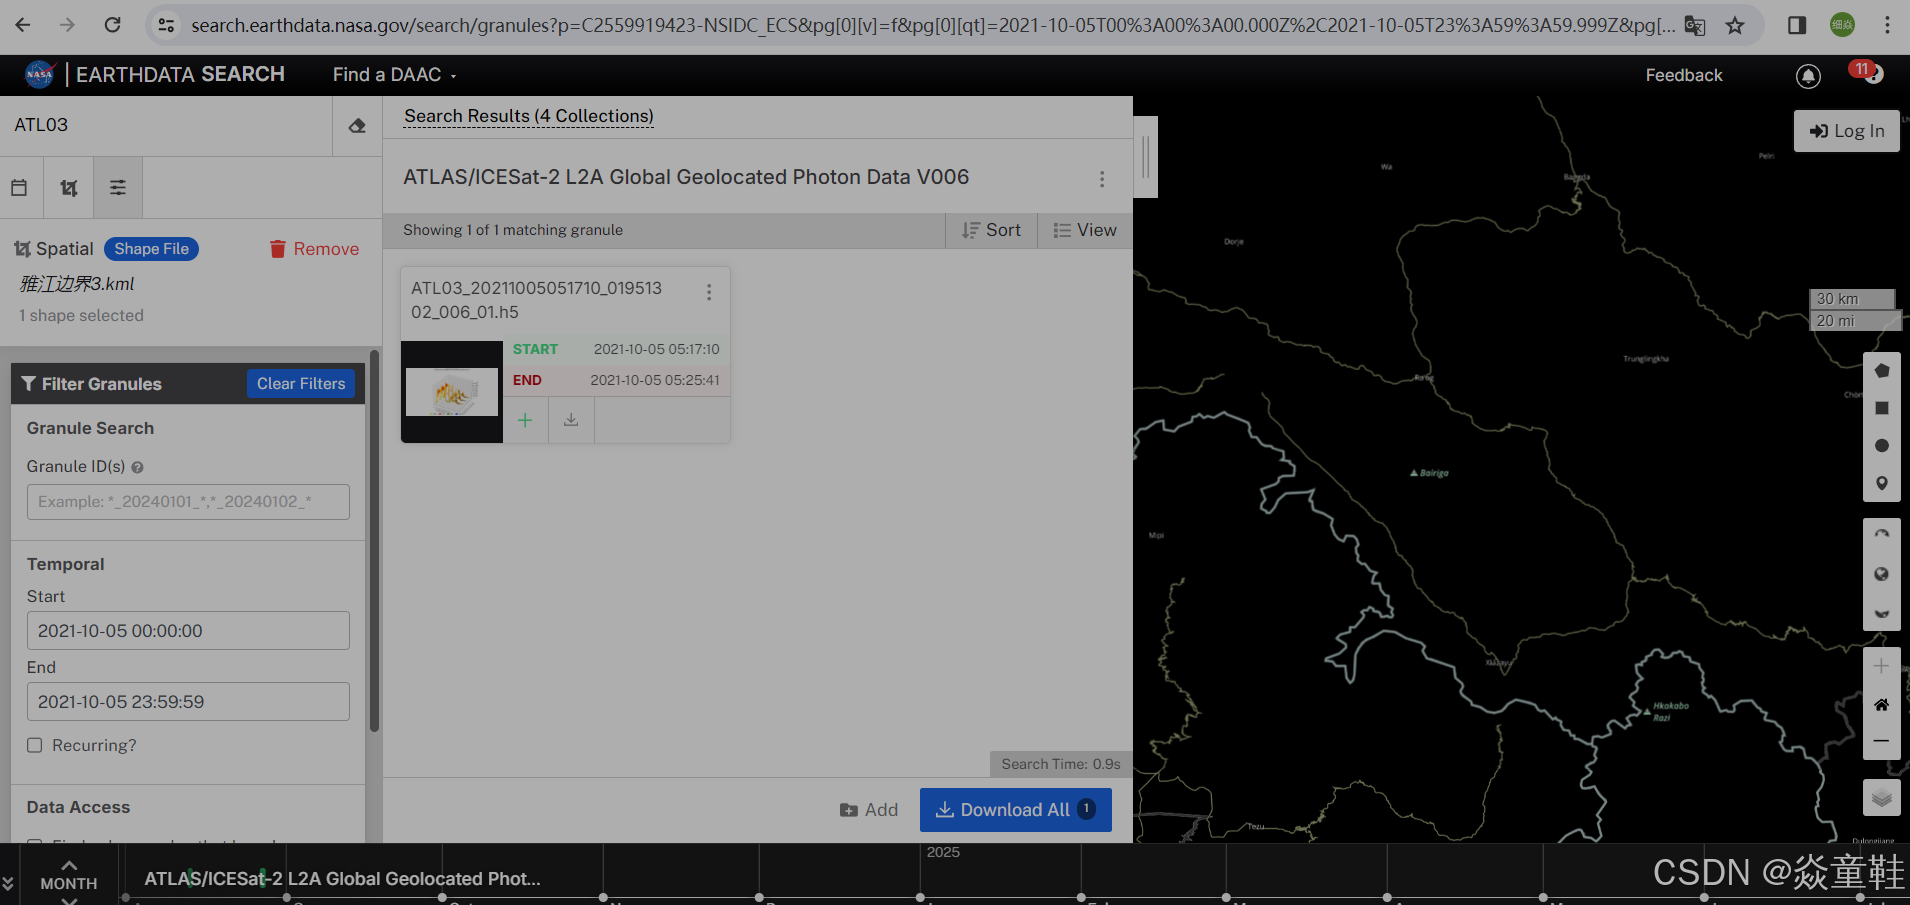
数据下载地址如下:Earthdata Search
选择指定区域的边界数据并下载,这里我下载了1个h5文件如图:
import os
import h5py
import pandas as pd
import geopandas as gpd
from shapely.geometry import Point
import numpy as np
from datetime import datetime, timezone

# 加载边界文件并只保留几何列
boundary = gpd.read_file("yajiang.shp")
boundary = boundary[['geometry']]

# 获取所有 HDF5 文件路径
document_names = [os.path.join(root, name) for root, dirs, files in os.walk("D:\swot3") for name in files if
                  name.endswith(".h5")]
group_names = ["gt1l", "gt2l", "gt3l", "gt1r", "gt2r", "gt3r"]

total_data = []


def get_atl03_x_atc(atl03_mds):
    # 提取数据结构
    val = atl03_mds

    # 初始化
    x_atc = np.full(len(val['heights']['h_ph']), np.nan)
    y_atc = np.full(len(val['heights']['h_ph']), np.nan)
    ref_elev_all = np.zeros(len(val['heights']['h_ph']))

    # 提取变量
    segment_id = val['geolocation']['segment_id'][:]
    segment_index_begin = val['geolocation']['ph_index_beg'][:] - 1
    segment_pe_count = val['geolocation']['segment_ph_cnt'][:]
    segment_distance = val['geolocation']['segment_dist_x'][:]
    segment_length = val['geolocation']['segment_length'][:]

    # 找到有效段的索引
    segment_indices = np.where((segment_index_begin[:-1] >= 0) & (segment_index_begin[1:] >= 0))[0]

    # 循环计算每个段的 x_atc 和 y_atc
    for j in segment_indices:
        # 当前段的起始索引
        idx = segment_index_begin[j]

        # 当前段光子数
        c1 = segment_pe_count[j]
        c2 = segment_pe_count[j + 1]
        cnt = c1 + c2

        # 沿轨道和跨轨道距离
        distance_along_x = val['heights']['dist_ph_along'][idx:idx + cnt]
        ref_elev = val['geolocation']['ref_elev'][j]

        # 更新段距离
        distance_along_x[:c1] += segment_distance[j]
        if j + 1 < len(segment_distance):
            distance_along_x[c1:cnt] += segment_distance[j + 1]
        distance_along_y = val['heights']['dist_ph_across'][idx:idx + cnt]

        # 填充结果
        x_atc[idx:idx + cnt] = distance_along_x
        y_atc[idx:idx + cnt] = distance_along_y
        ref_elev_all[idx:idx + c1] += ref_elev

    return {
        'x_atc': x_atc,
        'y_atc': y_atc,
        'ref_elev_all': ref_elev_all
    }


for document_name in document_names:
    print(f"Processing {document_name}")
    for group in group_names:
        try:
            with h5py.File(document_name, 'r') as f:
                gt_group = f[group]

                # 读取需要的数据
                altitude_sc = gt_group['geolocation']['altitude_sc'][:]
                delta_time = gt_group['heights']['delta_time'][:]
                lat = gt_group['heights']['lat_ph'][:]
                lon = gt_group['heights']['lon_ph'][:]
                h_ph = gt_group['heights']['h_ph'][:]
                dist_ph_along = gt_group['heights']['dist_ph_along'][:]
                dist_ph_across = gt_group['heights']['dist_ph_across'][:]
                quality_ph = gt_group['heights']['quality_ph'][:]
                weight_ph = gt_group['heights']['weight_ph'][:]
                signal_conf_ph = gt_group['heights']['signal_conf_ph'][:, 4]

                reference_photon_lat = gt_group['geolocation']['reference_photon_lat'][:]
                reference_photon_lon = gt_group['geolocation']['reference_photon_lon'][:]

                # 地球物理校正参数
                tide_pole = gt_group['geophys_corr']['tide_pole'][:]
                dem_h = gt_group['geophys_corr']['dem_h'][:]
                geoid_free2mean = gt_group['geophys_corr']['geoid_free2mean'][:]
                tide_earth = gt_group['geophys_corr']['tide_earth'][:]
                tide_load = gt_group['geophys_corr']['tide_load'][:]
                tide_oc_pole = gt_group['geophys_corr']['tide_oc_pole'][:]
                neutat_delay_total = gt_group['geolocation']['neutat_delay_total'][:]
                tide_ocean = gt_group['geophys_corr']['tide_ocean'][:]
                dac = gt_group['geophys_corr']['dac'][:]

                result = get_atl03_x_atc(gt_group)

                data_frame_cor = pd.DataFrame({
                    'lat': reference_photon_lat,
                    'lon': reference_photon_lon,
                    'tide_ocean': tide_ocean,
                    'dac': dac
                })

                data_frame_cor1 = gpd.GeoDataFrame(data_frame_cor,
                                                   geometry=gpd.points_from_xy(data_frame_cor.lon, data_frame_cor.lat),
                                                   crs="EPSG:4326")
                data_frame_cor2 = gpd.overlay(data_frame_cor1, boundary, how='intersection')

                data_frame = pd.DataFrame({
                    'lat': lat,
                    'lon': lon,
                    'time': delta_time,
                    'group': [group] * len(lat),
                    'x_atc': result['x_atc'],
                    'wse': h_ph,
                    'dist_ph_along': dist_ph_along,
                    'dist_ph_across': dist_ph_across,
                    'quality_ph': quality_ph,
                    'weight_ph': weight_ph,
                    'signal_conf_ph': signal_conf_ph
                })

                # 过滤数据
                data_frame = data_frame[(data_frame['lat'] >= 28.5) & (data_frame['lat'] <= 29.5) &
                                        (data_frame['lon'] >= 94.5) & (data_frame['lon'] <= 95.5) &
                                        (data_frame['wse'] < 1500)]

                data_frame_wse = gpd.GeoDataFrame(data_frame,
                                                  geometry=gpd.points_from_xy(data_frame.lon, data_frame.lat),
                                                  crs="EPSG:4326")
                data_frame_wse = data_frame_wse.to_crs(boundary.crs)
                wse_in_boundary = gpd.sjoin(data_frame_wse, boundary, how="inner", predicate="intersects")

                # 添加时间格式化和累积距离列
                wse_in_boundary['time'] = pd.to_datetime(wse_in_boundary['time'], unit='s', origin='2018-01-01')
                wse_in_boundary['dist_ph_along_sum'] = wse_in_boundary.groupby('group')['dist_ph_along'].cumsum()

                # 创建最终输出数据框
                data_wse = pd.DataFrame({
                    'lat': wse_in_boundary.geometry.y,
                    'lon': wse_in_boundary.geometry.x,
                    'time': wse_in_boundary['time'],
                    'group1': wse_in_boundary['group'],
                    'x_atc': wse_in_boundary['x_atc'],
                    'wse': wse_in_boundary['wse'],
                    'dist_ph_along': wse_in_boundary['dist_ph_along'],
                    'dist_ph_across': wse_in_boundary['dist_ph_across'],
                    'dist_ph_along_sum': wse_in_boundary['dist_ph_along_sum']
                })

                total_data.append(data_wse)

        except KeyError as e:
            print(f"Error processing {document_name} with group {group}: {e}")

# 合并所有数据
total_data_df = pd.concat(total_data, ignore_index=True)
total_data_df.to_csv('processed_sral_data.csv', index=False)
测高数据csv如下:
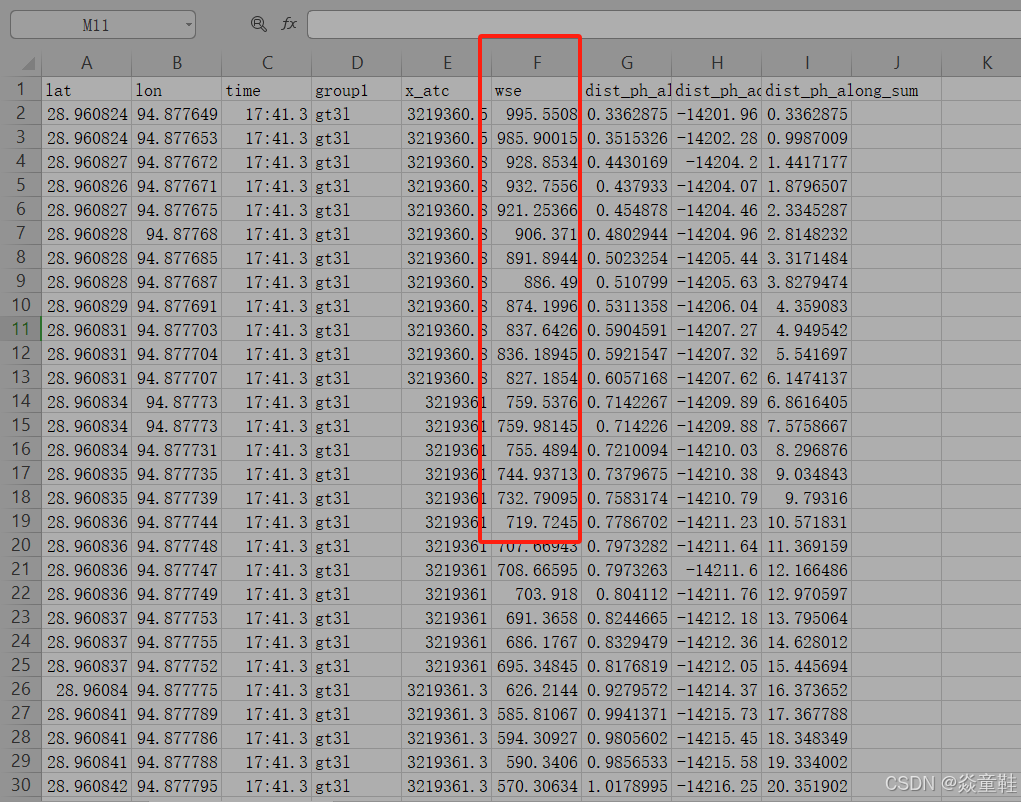
这边使用的是ATL03产品数据,后续使用HDBSCAN进行聚簇分组后计算每个断面的平均高程使用

魔乐社区(Modelers.cn) 是一个中立、公益的人工智能社区,提供人工智能工具、模型、数据的托管、展示与应用协同服务,为人工智能开发及爱好者搭建开放的学习交流平台。社区通过理事会方式运作,由全产业链共同建设、共同运营、共同享有,推动国产AI生态繁荣发展。
更多推荐


 4
4 0
0- 0


 已为社区贡献3条内容

所有评论(0)