pil对图像加透明 python_opencv和PIL读取和操作图片的区别和关系
·
1.图片读取
1.1 opencv-python读取图片
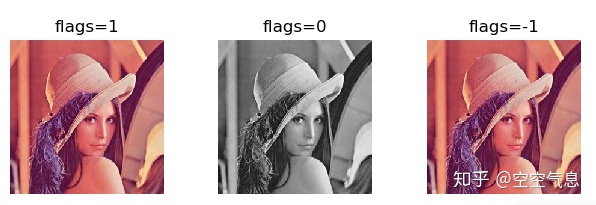
cv读取图片有三个模式,flags有三个值分别为1、0、-1,
flags=1 读取彩色图片忽略通道,此为默认值;
flags=0 读取灰度图;
flags=-1 读取彩色图包含通道值;
import numpy as np
import matplotlib.pyplot as plt

import cv2
import PIL.Image as Image
plt.figure(1)

ax1 = plt.subplot(1, 3, 1)
ax2 = plt.subplot(1, 3, 2)
ax3 = plt.subplot(1, 3, 3)

plt.sca(ax1)
img = cv2.imread('lena.png', flags=1)
img = cv2.cvtColor(img, cv2.COLOR_BGR2RGB)  #plt以RGB格式读取数组,而CV2是以BGR模式读取,所以需要转化
print(img.shape)
plt.title('flags=1')  # 图像标题
plt.axis('off')
plt.imshow(img)

plt.sca(ax2)
img = cv2.imread('lena.png', flags=0)
print(img.shape)
plt.title('flags=0')  # 图像标题
plt.axis('off')
plt.imshow(img, cmap='gray')

plt.sca(ax3)
img = cv2.imread('lena.png', flags=-1)
img = cv2.cvtColor(img, cv2.COLOR_BGR2RGB)
plt.title('flags=-1')  # 图像标题
plt.axis('off')
print(img.shape)
plt.imshow(img)
plt.show()
显示结果为:
1.2 PIL读取图片
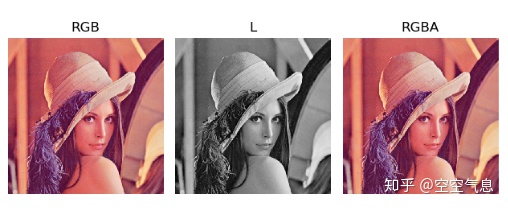
PIL读取图片时,使用.convert来定义读取图片类型:
| convert | 描述 | 名称 |
|---|---|---|
| 1 | 只有黑白(0,255),8位像素 | 位图 |
| L | 8位像素 | 灰度图 |
| P | 使用调色板映射到任何其他模式,8位像素 | |
| RGB | 使用调色板映射到任何其他模式,3x8位像素, | 彩色图 |
| RGBA | 使用调色板映射到任何其他模式+透明度,4x8位像素 | 彩色图+透明度 |
| YCbCr | 彩色视频格式,电视机,3×8位像素 | 亮度色彩分类 |
| CMYK | 应用在印刷领域,4个字母意思是青、洋红、黄、黑 | |
| 32位整型像素 | ||
| F | 32位浮点型像素 |
import numpy as np
import matplotlib.pyplot as plt
import cv2
import PIL.Image as Image

plt.figure(1)
img_path = 'lena.png'
ax1 = plt.subplot(1, 3, 1)
plt.sca(ax1)
plt.title('RGB')  # 图像标题
plt.axis('off')
img = Image.open(img_path).convert('RGB')
img = np.asarray(img, order='F')
print(img.shape)
plt.imshow(img)
# plt.show()

ax2 = plt.subplot(1, 3, 2)
plt.sca(ax2)
plt.title('L')  # 图像标题
plt.axis('off')
img =Image.open(img_path).convert('L')
img = np.asarray(img, order='F')
print(img.shape)
plt.imshow(img, cmap='gray')

ax3 = plt.subplot(1, 3, 3)
plt.sca(ax3)
plt.title('RGBA')  # 图像标题
plt.axis('off')
img =Image.open(img_path).convert('RGBA')
img = np.asarray(img, order='F')
print(img.shape)
plt.imshow(img)
plt.show()
显示结果为:
其中如果报错Python Numpy.ndarray ValueError:assignment destination is read-only,np.asarray(img, order='F') 的order是定义数组可以修改,默认参数不支持修改数组。
1.3 opencv和PIL相互转化
opencv读取图片是数组格式(numpy.ndarray),PIL则是Image类(PIL.Image.Image);
PIL转为opencv:
img_path = 'lena.png'
img = Image.open(img_path).convert('RGB')
img.show()

img = np.asarray(img, order='F')
img = cv2.cvtColor(img, cv2.COLOR_RGB2BGR)
cv2.imshow('a', img)
cv2.waitKey()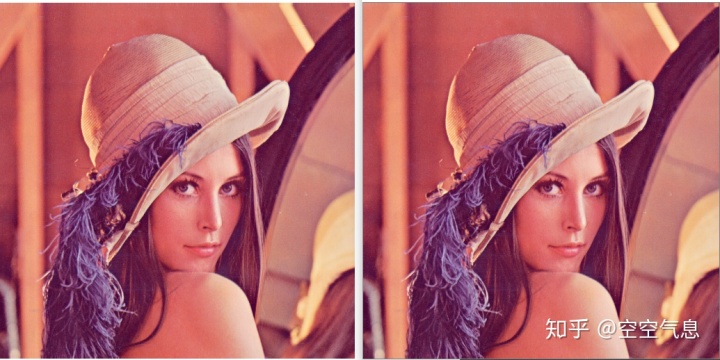
opencv转PIL:
img = cv2.imread(img_path)
img = cv2.cvtColor(img, cv2.COLOR_BGR2RGB) #BGR转RGB
img = Image.fromarray(img)
2. 图像旋转
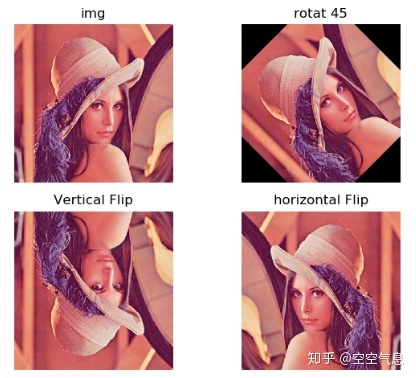
2.1 opencv 旋转、翻转图片
img = cv2.imread(img_path)
img = cv2.cvtColor(img, cv2.COLOR_BGR2RGB)
ax1 = plt.subplot(2, 2, 1)
plt.sca(ax1)
plt.title('img')  # 图像标题
plt.axis('off')
plt.imshow(img)

h, w, c = img.shape
center = (w // 2, h // 2)
mat = cv2.getRotationMatrix2D(center, 45, 1)  #1:旋转中心点位置,2:旋转角度,顺时针为正,逆时针未负 3.尺寸和原图的大小比例
rotated = cv2.warpAffine(img, mat, (w, h))
ax1 = plt.subplot(2, 2, 2)
plt.sca(ax1)
plt.title('rotat 45')  # 图像标题
plt.axis('off')
plt.imshow(rotated)

ax1 = plt.subplot(2, 2, 3)
plt.sca(ax1)
plt.title('Vertical Flip')  # 图像标题
plt.axis('off')
vert = img[::-1, :, :] #也可以使用cv2.flip(img, 0)
plt.imshow(vert)

ax1 = plt.subplot(2, 2, 4)
plt.sca(ax1)
plt.title('horizontal Flip')  # 图像标题
plt.axis('off')
hori = img[:, ::-1, :] #也可以使用cv2.flip(img, 1)
plt.imshow(hori)
plt.show()
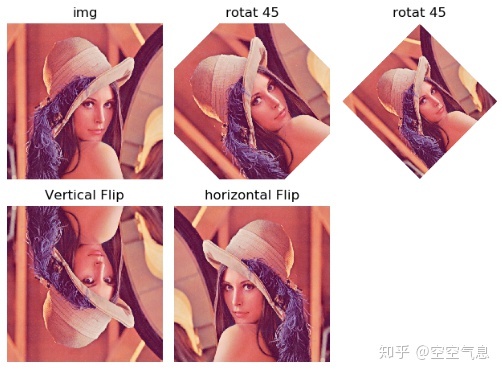
结果如图:
2.2 PIL图像旋转、翻转
img_path = 'lena.png'
img = Image.open(img_path)
img_pil = np.asarray(img)
print(img_pil.shape)
ax1 = plt.subplot(2, 3, 1)
plt.sca(ax1)
plt.title('img')  # 图像标题
plt.axis('off')
plt.imshow(img_pil)

img_rotat = img.rotate(45)
img_rotat_pil = np.asarray(img_rotat)
print(img_rotat_pil.shape)
ax1 = plt.subplot(2, 3, 2)
plt.sca(ax1)
plt.title('rotat 45')  # 图像标题
plt.axis('off')
plt.imshow(img_rotat_pil)

img_rotat = img.rotate(45, expand=True) #expand=True,自适应的扩大图像尺寸,来适应旋转后尺寸变换
img_rotat_pil = np.asarray(img_rotat)
print(img_rotat_pil.shape)
ax1 = plt.subplot(2, 3, 3)
plt.sca(ax1)
plt.title('rotat 45')  # 图像标题
plt.axis('off')
plt.imshow(img_rotat_pil)

ax1 = plt.subplot(2, 3, 4)
plt.sca(ax1)
plt.title('Vertical Flip')  # 图像标题
plt.axis('off')
vert = img.transpose(Image.FLIP_TOP_BOTTOM)
vert_pil = np.asarray(vert)
plt.imshow(vert_pil)

ax1 = plt.subplot(2, 3, 5)
plt.sca(ax1)
plt.title('horizontal Flip')  # 图像标题
plt.axis('off')
hori = img.transpose(Image.FLIP_LEFT_RIGHT)
hori_pil = np.asarray(hori)
plt.imshow(hori_pil)
plt.show()
结果,其中旋转角度是.rotate中参数expand=True时,会自适应的调整图像尺寸,来适应旋转后图像尺寸变话,显示看着是图像缩小了,这是显示的原因,实际尺寸旋转尺寸是不变的:
2.3 旋转固定90, 180, 270
opencv旋转90, 180, 270:
img = cv2.imread(img_path)
img = cv2.cvtColor(img, cv2.COLOR_BGR2RGB)
print(img.shape)

ax1 = plt.subplot(2, 2, 1)
plt.sca(ax1)
plt.title('img')  # 图像标题
plt.axis('off')
plt.imshow(img)

ax1 = plt.subplot(2, 2, 2)
plt.sca(ax1)
plt.title('rotat 90')  # 图像标题
plt.axis('off')
img_rot_90 = cv2.transpose(img)
img_rot_90 = cv2.flip(img_rot_90, 0)
print(img_rot_90.shape)
plt.imshow(img_rot_90)

ax1 = plt.subplot(2, 2, 3)
plt.sca(ax1)
plt.title('rotat 180')  # 图像标题
plt.axis('off')
# hori = img[:, ::-1, :]
img_rot_180 = cv2.flip(img, 0)
img_rot_180 = cv2.flip(img_rot_180, 1)
plt.imshow(img_rot_180)
#
ax1 = plt.subplot(2, 2, 4)
plt.sca(ax1)
plt.title('rotat 270')  # 图像标题
plt.axis('off')
img_rot_270 = cv2.flip(img, 0)
img_rot_270 = cv2.transpose(img_rot_270)
plt.imshow(img_rot_270)

plt.show()
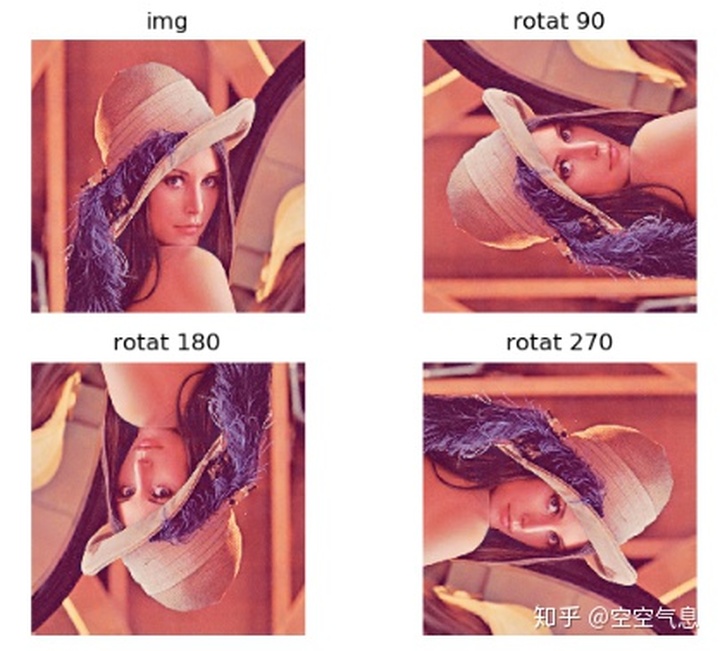
结果:
PIL旋转90、180、270:
img = Image.open(img_path)

ax1 = plt.subplot(2, 2, 1)
plt.sca(ax1)
plt.title('img')  # 图像标题
plt.axis('off')
plt.imshow(img)

img_rotat_90 = img.transpose(Image.ROTATE_90)
ax1 = plt.subplot(2, 2, 2)
plt.sca(ax1)
plt.title('rotat 90')  # 图像标题
plt.axis('off')
plt.imshow(img_rotat_90)

ax1 = plt.subplot(2, 2, 3)
plt.sca(ax1)
plt.title('rotat 180')  # 图像标题
plt.axis('off')
img_rotat_180 = img.transpose(Image.ROTATE_180)
plt.imshow(img_rotat_180)

ax1 = plt.subplot(2, 2, 4)
plt.sca(ax1)
plt.title('rotat 270')  # 图像标题
plt.axis('off')
img_rotat_270 = img.transpose(Image.ROTATE_270)
plt.imshow(img_rotat_270)
plt.show()
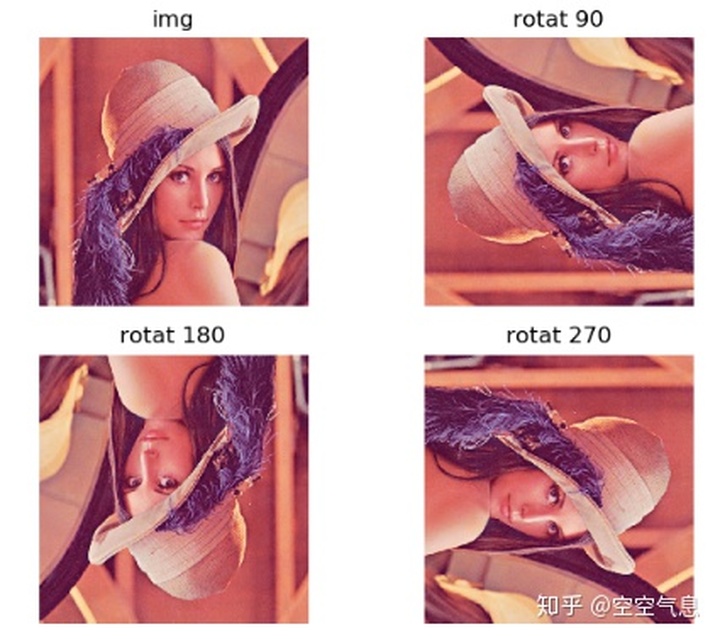
结果:
持续更新其他操作。。。2020/11/23

魔乐社区(Modelers.cn) 是一个中立、公益的人工智能社区,提供人工智能工具、模型、数据的托管、展示与应用协同服务,为人工智能开发及爱好者搭建开放的学习交流平台。社区通过理事会方式运作,由全产业链共同建设、共同运营、共同享有,推动国产AI生态繁荣发展。
更多推荐


 0
0 0
0- 0


 已为社区贡献2条内容

所有评论(0)