容器场景下的日志解决方案
公司业务系统整体通过容器化方案部署在K8S集群中,业务的流量通过APISix网关进行管理。基本上所有的前端页面请求,后端接口请求流量都会经过APISix,这些请求数据有非常重要的业务分析价值。因此需要把APISix的请求日志打到大数据平台中。通过调研最后选择了loggie作为这个解决方案的工具。
·
背景说明
公司业务系统整体通过容器化方案部署在K8S集群中,业务的流量通过APISix网关进行管理。基本上所有的前端页面请求,后端接口请求流量都会经过APISix,这些请求数据有非常重要的业务分析价值。因此需要把APISix的请求日志打到大数据平台中。通过调研最后选择了loggie作为这个解决方案的工具。数据流如下:
用户浏览器请求->APISix日志->loggie->kafka->大数据平台
整个日志的采集方案不光可以运用到上面的场景,还可以运用很多场景,参考官方的图片如下: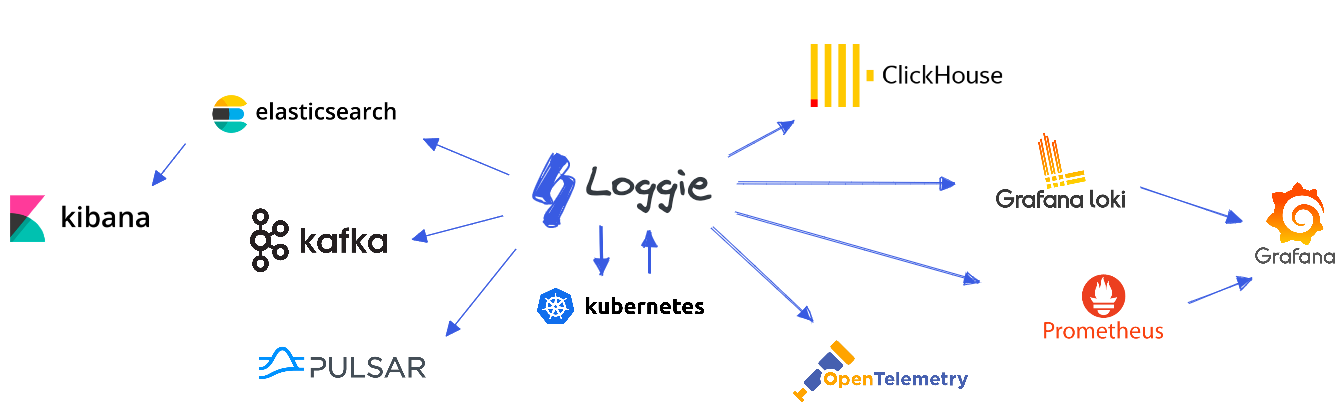
注意事项
- 由于该项目在2024年以后就没有更新的记录了,感觉已经没有人维护了。组件所适配的其他组件的版本要特别关注,我的场景里面就踩坑kafka的版本,目前仅适配到2.7.1
- 同样由于项目更新的问题,所使用的K8S的接口,CRI的接口在新的K8S版本中可能已经被删除了,会导致故障。我的场景里面踩坑CRI的版本,通过自己修改源代码解决。修改后的代码库和镜像地址在文末给出
环境说明
- Kubernetes
Client Version: v1.32.3
Kustomize Version: v5.5.0
Server Version: v1.32.3
- 容器运行时
containerd github.com/containerd/containerd v1.7.27 05044ec0a9a75232cad458027ca83437aae3f4da
- 操作系统和内核
NAME="openEuler"
VERSION="24.03 (LTS)"
ID="openEuler"
VERSION_ID="24.03"
PRETTY_NAME="openEuler 24.03 (LTS)"
ANSI_COLOR="0;31"
Linux master-01 6.6.0-28.0.0.34.oe2403.aarch64 #1 SMP Mon May 27 22:43:49 CST 2024 aarch64 aarch64 aarch64 GNU/Linux
- kafka信息
版本: 2.7.1
#启用SASL认证,server.properties信息如下,具体kafka的部署请参考其他文章
sasl.mechanism.inter.broker.protocol=PLAIN
sasl.enabled.mechanisms=PLAIN
inter.broker.listener.name=SASL_PLAINTEXT
实施步骤
集群中安装loggie
#通过helm安装
1. clone loggie官方的chart到本地
git clone https://github.com/loggie-io/installation.git
cd helm-chart
2. 修改values.yaml文件以适配本地情况,我使用的values.yaml文件如下。配置中相关的路径需要根据实际情况修改
image: harbor.whyxpt.site/release/loggie:v1.5.1

resources:
  limits:
    cpu: 2
    memory: 2Gi
  requests:
    cpu: 100m
    memory: 100Mi

extraArgs: {}
  # log.level: debug
  # log.jsonFormat: true

extraVolumeMounts:
  - mountPath: /var/log/pods
    name: podlogs
  - mountPath: /var/lib/docker/containers
    name: dockercontainers
  - mountPath: /var/lib/kubelet/pods
    name: kubelet
  - mountPath: /opt/data
    name: db

extraVolumes:
  - hostPath:
      path: /var/log/pods
      type: DirectoryOrCreate
    name: podlogs
  - hostPath:
      path: /data/lib/docker/containers
      type: DirectoryOrCreate
    name: dockercontainers
  - hostPath:
      path: /data/lib/kubelet/pods
      type: DirectoryOrCreate
    name: kubelet
  - hostPath:
      path: /data/lib/loggie
      type: DirectoryOrCreate
    name: db

extraEnvs: {}
timezone: Asia/Shanghai

## ref: https://kubernetes.io/docs/concepts/configuration/assign-pod-node/
nodeSelector: {}

## Affinity for pod assignment
## ref: https://kubernetes.io/docs/concepts/configuration/assign-pod-node/#affinity-and-anti-affinity
affinity: {}
# podAntiAffinity:
#   requiredDuringSchedulingIgnoredDuringExecution:
#   - labelSelector:
#       matchExpressions:
#       - key: app
#         operator: In
#         values:
#         - loggie
#     topologyKey: "kubernetes.io/hostname"

## Tolerations for pod assignment
## ref: https://kubernetes.io/docs/concepts/configuration/taint-and-toleration/
tolerations: []
# - effect: NoExecute
#   operator: Exists
# - effect: NoSchedule
#   operator: Exists

updateStrategy:
  type: RollingUpdate

## Agent mode, ignored when aggregator.enabled is true
config:
  loggie:
    reload:
      enabled: true
      period: 10s
    monitor:
      logger:
        period: 30s
        enabled: true
      listeners:
        filesource:
          period: 10s
        filewatcher:
          period: 5m
        reload:
          period: 10s
        sink:
          period: 10s
        queue:
          period: 10s
        pipeline:
          period: 10s
    db:
      file: /opt/data/loggie.db
    discovery:
      enabled: true
      kubernetes:
        # Choose: docker or containerd
        containerRuntime: containerd
        # Collect log files inside the container from the root filesystem of the container, no need to mount the volume
        rootFsCollectionEnabled: true
        # Automatically parse and convert the wrapped container standard output format into the original log content
        parseStdout: false
        # If set to true, it means that the pipeline configuration generated does not contain specific Pod paths and meta information,
        # and these data will be dynamically obtained by the file source, thereby reducing the number of configuration changes and reloads.
        dynamicContainerLog: false
        # Automatically add fields when selector.type is pod in logconfig/clusterlogconfig
        typePodFields:
          logconfig: "${_k8s.logconfig}"
          namespace: "${_k8s.pod.namespace}"
          nodename: "${_k8s.node.name}"
          podname: "${_k8s.pod.name}"
          containername: "${_k8s.pod.container.name}"

    http:
      enabled: true
      port: 9196

## Aggregator mode, by default is disabled
aggregator:
  enabled: false
  replicas: 2
  config:
    loggie:
      reload:
        enabled: true
        period: 10s
      monitor:
        logger:
          period: 30s
          enabled: true
        listeners:
          reload:
            period: 10s
          sink:
            period: 10s
      discovery:
        enabled: true
        kubernetes:
          cluster: aggregator
      http:
        enabled: true
        port: 9196
servicePorts:
  - name: monitor
    port: 9196
    targetPort: 9196
#  - name: gprc
#    port: 6066
#    targetPort: 6066
serviceMonitor:
  enabled: false
  ## Scrape interval. If not set, the Prometheus default scrape interval is used.
  interval: 30s
  relabelings: []
  metricRelabelings: []
3. 安装loggie
helm upgrade --install loggie helm-chart -n prd-public-service
4. 查看loggie 运行情况,确保所有为Running状态
kubectl get node -n prd-public-server|grep loggie
通过CRD方式配置容器日志采集
- 我需要采集apisix的日志,该Pod都具有标签app=apisix,yaml 文件内容如下:
日志推送到Kafka
apiVersion: loggie.io/v1beta1
kind: LogConfig
metadata:
  name: apisix-to-kafka
spec:
  selector:
    type: pod
    labelSelector:
      app: apisix
  pipeline:
    sources: |
      - type: file
        name: nginx
        paths:
          - /var/log/nginx/*.json
    interceptors: |
      - type: transformer
        actions:
         - action: jsonDecode(body)
    sink: |
      type: kafka
      brokers:
         - 10.128.40.3:9092
      topic: "loggie"
      sasl:
        # 可选scram和plain
        type: plain
        mechanism: SCRAM-SHA-256
        username: "kafka"
        password: "******!"
        # 当选择scram时生效,可选sha256,sha512
        algorithm: sha256
日志推送到elasticsearch
apiVersion: loggie.io/v1beta1
kind: LogConfig
metadata:
  name: apisix-to-elasticsearch
spec:
  selector:
    type: pod
    labelSelector:
      app: apisix
  pipeline:
    sources: |
      - type: file
        name: apisix
        paths:
          - /usr/local/apisix/logs/*.json
    interceptors: |
      - type: transformer
        actions:
         - action: jsonDecode(body)
         - action: strconv(request_time, float)
         - action: strconv(upstream_response_time, float)
    sink: |
         type: elasticsearch
         hosts: ["172.88.101.23:9200","172.88.101.24:9200","172.88.101.25:9200"]
         index: "loggie-${+YYYY.MM.DD}"
         schema: "http"
         username: "elastic"
         password: "Sew****EeuPU"
- 查看kafka中由loggie采集的日志
bin/kafka-console-consumer.sh  --consumer.config client.properties \
--bootstrap-server 10.128.40.3:9092 \
--topic loggie  --from-beginning
输出示例:
#由于apisix的日志格式已经做了规范,输出为json格式,所以在采集定义的时候通过transformer的jsonDecode进行格式化,
#这样大数据平台就可以直接消费并处理这些数据,同时如果loggie后端对接es,也可以使用字段进行查询
{"@timestamp":"2025-07-12T01:40:13+08:00","application_name":"default-applicaton","uri":"/index.html","remote_addr":"10.130.0.127","remote_user":"-","server_addr":"10.130.1.230","upstream_response_time":"-","upstream_addr":"-","body_bytes_sent":"615","http_referer":"-","request_filename":"/usr/local/nginx/html/index.html","fields":{"namespace":"prd-public-service","nodename":"k8s-worker-1","podname":"kydy-admin-view-56ff464f45-bff6p","containername":"kydy-admin-view","logconfig":"front-end-applications"},"http_host":"10.68.124.224","request_time":"0.000","http_x_forwarded_for":"-","proxy_protocol_addr":"-","request":"GET / HTTP/1.1","status":"200","http_user_agent":"curl/7.29.0"}
文献和材料说明
- CRD的使用说明请参考官方的文档
https://loggie-io.github.io/docs/main/reference/discovery/kubernetes/logconfig/ - 修改K8S CRI版本的代码地址
https://gitee.com/kevinliu_CQ/loggie - 修改版本后的镜像地址
x86_64架构: registry.cn-hangzhou.aliyuncs.com/dockerforkevin/loggie:1.5.1
arm64架构: registry.cn-hangzhou.aliyuncs.com/dockerforkevin/loggie-arm:v1.5.1
该方案适合所有的容器化日志采集,如有疑问请私信。另外loggie已经很久没有更新了,个人感觉这是一个非常好的项目,希望社区的维护者可以持续更新,同时感谢他们提供这么好的项目。

魔乐社区(Modelers.cn) 是一个中立、公益的人工智能社区,提供人工智能工具、模型、数据的托管、展示与应用协同服务,为人工智能开发及爱好者搭建开放的学习交流平台。社区通过理事会方式运作,由全产业链共同建设、共同运营、共同享有,推动国产AI生态繁荣发展。
更多推荐


 5
5 0
0- 0


 已为社区贡献1条内容

所有评论(0)