用 AntV MCP Server Chart 赋能大模型 —— 从零构建可视化智能体,图表生成效率飙升!大模型入门到精通,收藏这篇就足够了!
在大模型驱动的智能数据时代,图表生成(Chart Generation)的准确性严重依赖对数据结构和可视化意图的深度理解。传统方法往往依赖复杂的 Prompt 工程或繁琐的手动编码,不仅效率低下,还难以适配多样化的数据格式与图表需求。
本文将带你基于 AntV MCP Server Chart 构建一个“可视化智能体”——让大模型不仅能“读懂数据”,还能“画出专业图表”,显著提升图表生成的准确性与自动化水平!
🎬 运行效果
🎯 核心价值
- 无需前端知识:开发者无需掌握 D3、ECharts 或 AntV 前端语法。
- 25+ 图表类型开箱即用:覆盖柱状图、折线图、桑基图、词云、组织架构图等主流可视化场景。
- 支持私有化部署:保障数据安全,适配企业内网环境。
- MCP 协议标准化调用:通过 Model Context Protocol 实现大模型与可视化服务的无缝集成。
🧭 本文结构概览
- 环境准备:搭建 MCP-Hub 与图表渲染服务
- 私有化部署:配置 AntV MCP Server Chart + GPT-VIS-API + MinIO
- 核心逻辑:大模型如何生成 SQL 与推荐图表类型
- 智能渲染:通过 React Agent 调用 MCP 工具生成图表
- 总结与推荐:总结&完整代码获取
1️⃣ 环境准备:搭建 MCP 工具中枢
1.1 安装 MCP-Hub
MCP-Hub 是一个开源的 MCP(Model Context Protocol)工具聚合平台,用于统一管理、注册和调用各类 MCP 服务。
docker run -d \ --name mcphub \ -p 3300:3000 \ --add-host host.docker.internal:host-gateway \ samanhappy/mcphub
访问地址:http://localhost:3300
默认账号:admin / admin123
国内加速配置(推荐)
- Python 包源:https://mirrors.aliyun.com/pypi/simple
- NPM 源:https://registry.npmmirror.com
2️⃣ 服务部署:构建私有化图表生成引擎
2.1 部署 MinIO 对象存储(用于图表持久化)
MinIO 作为轻量级 S3 兼容对象存储,用于保存生成的图表图片。
docker run -d \ --name minio \ -p 19000:9000 \ -p 19001:9001 \ -v "$(pwd)/volume/minio/data:/data" \ -e MINIO_ROOT_USER=admin \ -e MINIO_ROOT_PASSWORD=12345678 \ minio/minio:RELEASE.2025-04-22T22-12-26Z \ server /data --console-address ":9001"
配置步骤:
- 访问控制台:http://localhost:19001
- 创建 Bucket:chart-images
- 设置 Bucket 为 public 可读
- 生成 Access Key 与 Secret Key(用于后续服务认证)
2.2 部署 GPT-VIS-API(图表渲染服务)
我开源的项目: https://github.com/apconw/gpt-vis-api
GPT-VIS-API 是专为私有化场景设计的轻量级图表生成服务,接收结构化数据,调用 AntV 渲染图表,并将结果上传至 MinIO,返回带签名的图片 URL。
docker run -d \ --name gpt-vis-api \ -p 3100:3000 \ --add-host host.docker.internal:host-gateway \ -e MINIO_ENDPOINT=host.docker.internal \ -e MINIO_PORT=19000 \ -e MINIO_USE_SSL=false \ -e MINIO_ACCESS_KEY=your-access-key \ -e MINIO_SECRET_KEY=your-secret-key \ -e MINIO_BUCKET=chart-images \ -e MINIO_PUBLIC_DOMAIN="http://localhost:19000" \ crpi-7xkxsdc0iki61l0q.cn-hangzhou.personal.cr.aliyuncs.com/apconw/gpt-vis-api:0.0.1
注意:生产环境中需将 host.docker.internal 替换为实际服务器 IP。
验证服务是否正常
curl -X POST http://localhost:3100/generate \ -H "Content-Type: application/json" \ -d '{ "type": "line", "data": [ {"time": "2025-05", "value": 512}, {"time": "2025-06", "value": 1024} ] }'
✅ 成功响应应包含类似:
{ "url": "http://localhost:19000/chart-images/chart-abc123.png?Expires=..."}
2.3 安装 AntV MCP Server Chart
通过 MCP-Hub 注册 AntV 图表工具:
npx -y @antv/mcp-server-chart
并在 MCP-Hub 中配置环境变量:
VIS_REQUEST_SERVER=http://host.docker.internal:3100/generate
此配置使 AntV MCP 工具将图表渲染请求转发至 GPT-VIS-API。⚠️官方工具图片渲染默认使用公网服务.这里配置解决了私有化部署问题!!
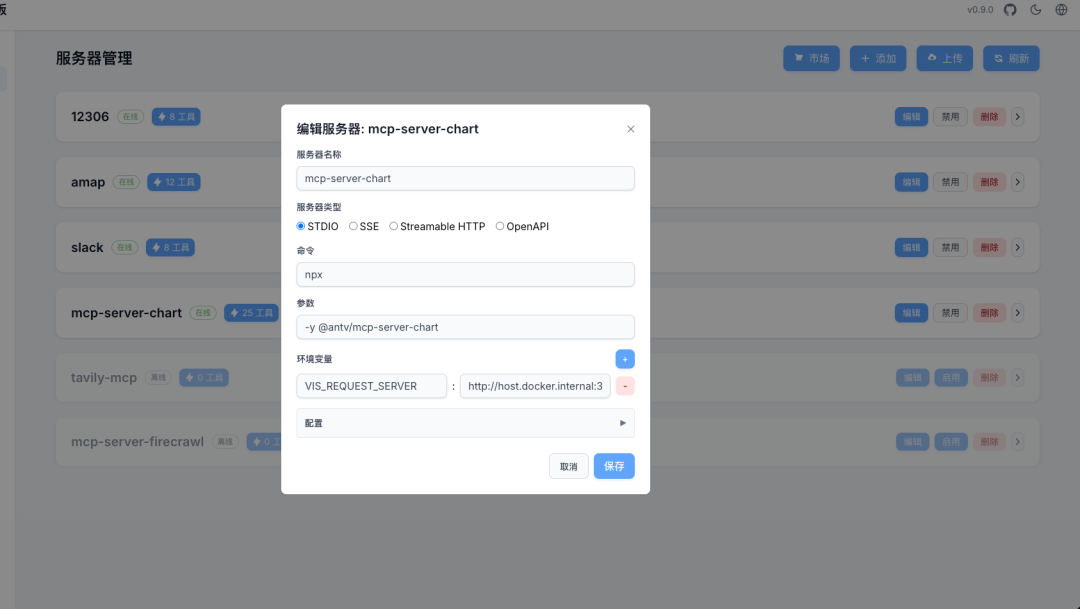
配置
3️⃣ 核心逻辑:大模型生成 SQL 与推荐图表类型
通过结构化 Prompt 引导大模型完成两项关键任务:
- 生成可执行的 SQL 查询
- 根据查询结果语义推荐最合适的图表类型
3.1 Prompt 设计要点
- 明确角色:专业 DBA + BI 分析师
- 提供上下文:表结构、表关系、当前时间
- 约束输出:仅返回 JSON,包含 sql_query 和 chart_type
- 内置 25+ 图表类型定义(如 generate_line_chart, generate_sankey_chart 等)
3.2 输出示例
{ "sql_query": "SELECT DATE(created_at) AS day, COUNT(*) AS orders FROM orders GROUP BY day ORDER BY day;", "chart_type": "generate_line_chart"}
3.3 核心代码片段(SQL 与图表推荐)
import jsonimport tracebackfrom langchain.prompts import ChatPromptTemplatefrom datetime import datetimeimport loggingfrom agent.text2sql.analysis.llm_util import get_llmlogger = logging.getLogger(__name__)def sql_generate(state): llm = get_llm() prompt = ChatPromptTemplate.from_template( """ 你是一位专业的数据库管理员(DBA),任务是根据提供的数据库结构、表关系以及用户需求,生成优化的MYSQL SQL查询语句,并推荐合适的可视化图表。 ## 任务 - 根据用户问题生成一条优化的SQL语句。 - 根据查询生成逻辑从**图表定义**中选择最合适的图表类型。 ## 约束条件 1. 你必须仅生成一条合法、可执行的SQL查询语句 —— 不得包含解释、Markdown、注释或额外文本。 2. **必须直接且完整地使用所提供的表结构和表关系来生成SQL语句**。 3. 你必须严格遵守数据类型、外键关系及表结构中定义的约束。 4. 使用适当的SQL子句(JOIN、WHERE、GROUP BY、HAVING、ORDER BY、LIMIT等)以确保准确性和性能。 5. 若问题涉及时序,请合理使用提供的“当前时间”上下文(例如用于相对日期计算)。 6. 不得假设表结构中未明确定义的列或表。 7. 如果用户问题模糊或者缺乏足够的信息以生成正确的查询,请返回:`NULL` ## 提供的信息 - 表结构:{db_schema} - 表关系:{table_relationship} - 用户提问:{user_query} - 当前时间:{current_time} ## 图表定义 - generate_area_chart: used to display the trend of data under a continuous independent variable, allowing observation of overall data trends. - generate_bar_chart: used to compare values across different categories, suitable for horizontal comparisons. - generate_boxplot_chart: used to display the distribution of data, including the median, quartiles, and outliers. - generate_column_chart: used to compare values across different categories, suitable for vertical comparisons. - generate_district_map: Generate a district-map, used to show administrative divisions and data distribution. - generate_dual_axes_chart: Generate a dual-axes chart, used to display the relationship between two variables with different units or ranges. - generate_fishbone_diagram: Generate a fishbone diagram, also known as an Ishikawa diagram, used to identify and display the root causes of a problem. - generate_flow_diagram: Generate a flowchart, used to display the steps and sequence of a process. - generate_funnel_chart: Generate a funnel chart, used to display data loss at different stages. - generate_histogram_chart: Generate a histogram, used to display the distribution of data by dividing it into intervals and counting the number of data points in each interval. - generate_line_chart: Generate a line chart, used to display the trend of data over time or another continuous variable. - generate_liquid_chart: Generate a liquid chart, used to display the proportion of data, visually representing percentages in the form of water-filled spheres. - generate_mind_map: Generate a mind-map, used to display thought processes and hierarchical information. - generate_network_graph: Generate a network graph, used to display relationships and connections between nodes. - generate_organization_chart: Generate an organizational chart, used to display the structure of an organization and personnel relationships. - generate_path_map: Generate a path-map, used to display route planning results for POIs. - generate_pie_chart: Generate a pie chart, used to display the proportion of data, dividing it into parts represented by sectors showing the percentage of each part. - generate_pin_map: Generate a pin-map, used to show the distribution of POIs. - generate_radar_chart: Generate a radar chart, used to display multi-dimensional data comprehensively, showing multiple dimensions in a radar-like format. - generate_sankey_chart: Generate a sankey chart, used to display data flow and volume, representing the movement of data between different nodes in a Sankey-style format. - generate_scatter_chart: Generate a scatter plot, used to display the relationship between two variables, showing data points as scattered dots on a coordinate system. - generate_treemap_chart: Generate a treemap, used to display hierarchical data, showing data in rectangular forms where the size of rectangles represents the value of the data. - generate_venn_chart: Generate a venn diagram, used to display relationships between sets, including intersections, unions, and differences. - generate_violin_chart: Generate a violin plot, used to display the distribution of data, combining features of boxplots and density plots to provide a more detailed view of the data distribution. - generate_word_cloud_chart: Generate a word-cloud, used to display the frequency of words in textual data, with font sizes indicating the frequency of each word. - generate_table: Generate a structured table, used to organize and present data in rows and columns, facilitating clear and concise information display for easy reading and analysis. ## 输出格式 - 你**必须且只能**输出一个符合以下结构的 **纯 JSON 对象**,不得包含任何额外文本、注释、换行或 Markdown 格式: ```json {{ "sql_query": "生成的SQL语句字符串", "chart_type": "推荐的图表类型字符串,如 \"generate_area_chart\"" }} """ ) chain = prompt | llm try: response = chain.invoke( { "db_schema": state["db_info"], "user_query": state["user_query"], "table_relationship": state.get("table_relationship", []), "current_time": datetime.now().strftime("%Y-%m-%d %H:%M:%S"), } ) state["attempts"] += 1 clean_json_str = response.content.strip().removeprefix("```json").strip().removesuffix("```").strip() state["generated_sql"] = json.loads(clean_json_str)["sql_query"] # mcp-hub 服务默认添加前缀防止重复问题 state["chart_type"] = "mcp-server-chart-" + json.loads(clean_json_str)["chart_type"] except Exception as e: traceback.print_exception(e) logger.error(f"Error in generating: {e}") state["generated_sql"] = "No SQL query generated" return state
4️⃣ 智能渲染:调用 MCP 工具生成图表
4.1 构建 React Agent
使用 LangGraph 的 create_react_agent 构建一个轻量级智能体,专门负责图表渲染:
- 动态过滤工具:仅加载当前所需的图表工具(如 mcp-server-chart-generate_line_chart),减少 Token 消耗与幻觉风险。
- 自动填充参数:根据数据结构推断 X/Y 轴、标题、图例等配置。
- 强制中文标签:确保图表可读性。
4.2 渲染流程
- 执行 SQL 获取结果数据
- 将数据与图表类型传入 Agent
- Agent 调用对应 MCP 工具
- 工具调用 GPT-VIS-API 生成图片并返回 URL 最终输出:图表
4.3 核心代码片段(图表渲染)
import osfrom langchain_mcp_adapters.client import MultiServerMCPClientfrom langchain_openai import ChatOpenAIfrom langgraph.prebuilt import create_react_agentasync def data_render_ant(state: AgentState): client = MultiServerMCPClient({ "mcphub-sse": { "url": os.getenv("MCP_HUB_DATABASE_QA_GROUP_URL"), "transport": "streamable_http", } }) chart_type = state["chart_type"] tools = await client.get_tools() tools = [tool for tool in tools if tool.name == chart_type] llm = ChatOpenAI( model=os.getenv("MODEL_NAME", "qwen-plus"), temperature=float(os.getenv("MODEL_TEMPERATURE", 0.75)), base_url=os.getenv("MODEL_BASE_URL"), api_key=os.getenv("MODEL_API_KEY"), streaming=True, ) result_data = state["execution_result"] chart_agent = create_react_agent( model=llm, tools=tools, prompt=f""" 你是一位经验丰富的BI专家,擅长根据数据特征自动选择最合适的MCP图表工具,并完成图表渲染。 ### 任务步骤 1. **分析数据特征**:理解输入的原始数据结构(如维度、指标、数据类型、数据量等)。 2. **选择最优图表类型**:基于数据特征,从MCP图表库中选择最适合的图表工具。 3. **读取工具Schema**:获取所选MCP图表工具的参数配置规范(JSON Schema)。 4. **填充参数**:根据原始数据和可视化目标,按Schema要求填充图表参数。 5. **生成图表**:调用MCP工具渲染图表,并返回图表链接。 ### 输入数据 {result_data} ### 要求 - 不要解释图表内容或生成文字说明。 - 必须返回符合格式的图表链接。 - 图表需清晰表达数据关系,符合可视化最佳实践。 - x轴和y轴的标签必须使用中文显示。 ### 返回格式 [图表](https://example.com/chart.png) """, ) result = await chart_agent.ainvoke( {"messages": [("user", "根据输入数据选择合适的MCP图表工具进行渲染")]}, config={"configurable": {"thread_id": "chart-render"}}, ) state["chart_url"] = result["messages"][-1].content return state
5️⃣ 总结
✅ 本文成果
- 成功构建端到端的 “自然语言 → SQL → 图表” 自动化流水线
- 实现大模型与专业可视化能力的 标准化对接
- 支持完全私有化部署,满足企业级安全合规要求
📚 完整代码
**参考我的开源项目:**git@github.com:apconw/sanic-web.git
🌈 项目亮点
- ✅ 集成 MCP 多智能体架构
- ✅ 支持 Dify / LangChain / LlamaIndex / Ollama / vLLM / Neo4j
- ✅ 前端采用 Vue3 + TypeScript + Vite5,现代化交互体验
- ✅ 内置 ECharts / AntV 图表问答 + CSV 表格问答
- ✅ 支持对接主流 RAG 系统 与 Text2SQL 引擎
- ✅ 轻量级 Sanic 后端,适合快速部署与二次开发
- ✅ 项目已被蚂蚁官方推荐收录
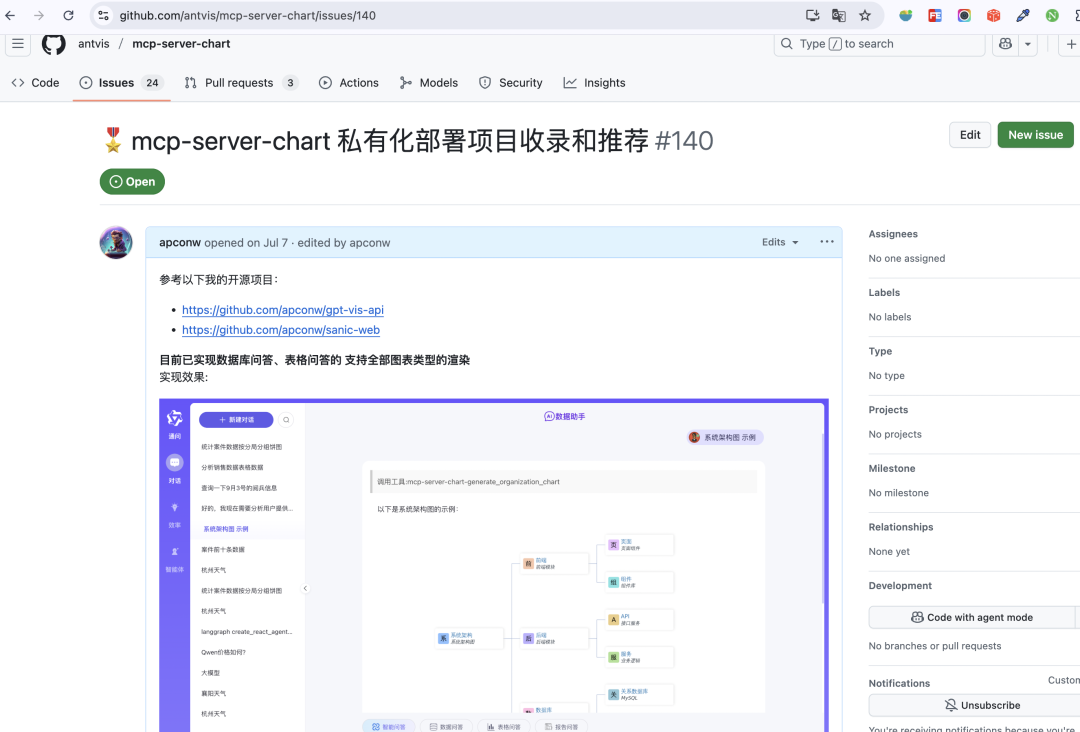
AntV
运行效果:
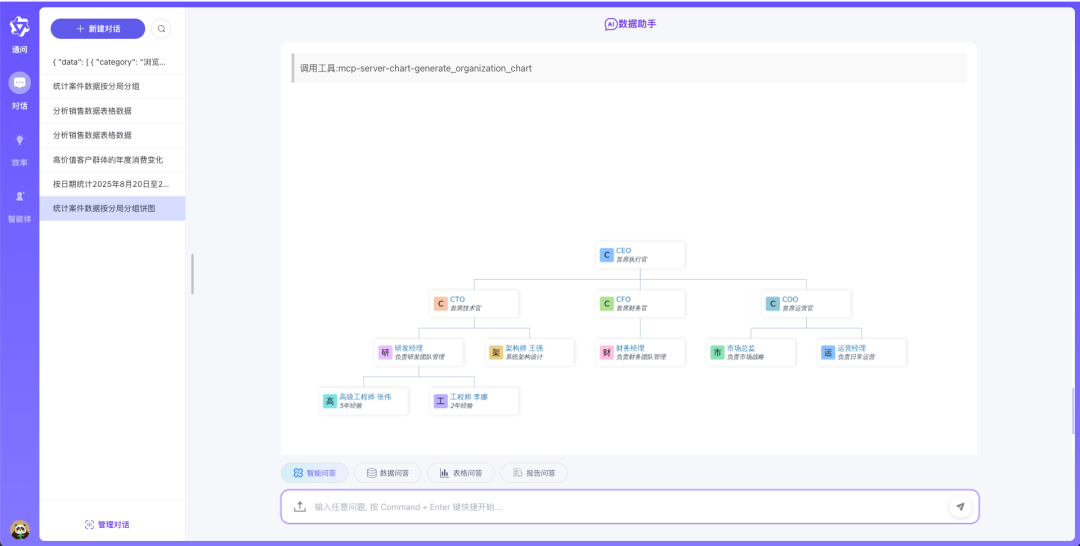
智能问答
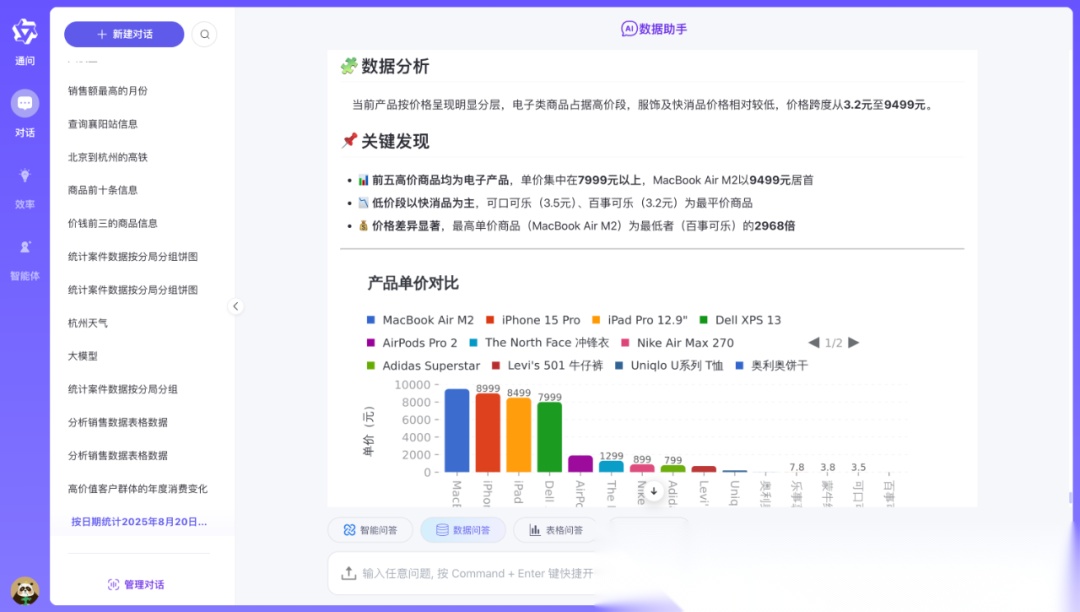
想入门 AI 大模型却找不到清晰方向?备考大厂 AI 岗还在四处搜集零散资料?别再浪费时间啦!2025 年 AI 大模型全套学习资料已整理完毕,从学习路线到面试真题,从工具教程到行业报告,一站式覆盖你的所有需求,现在全部免费分享!
👇👇扫码免费领取全部内容👇👇

一、学习必备:100+本大模型电子书+26 份行业报告 + 600+ 套技术PPT,帮你看透 AI 趋势
想了解大模型的行业动态、商业落地案例?大模型电子书?这份资料帮你站在 “行业高度” 学 AI:
1. 100+本大模型方向电子书
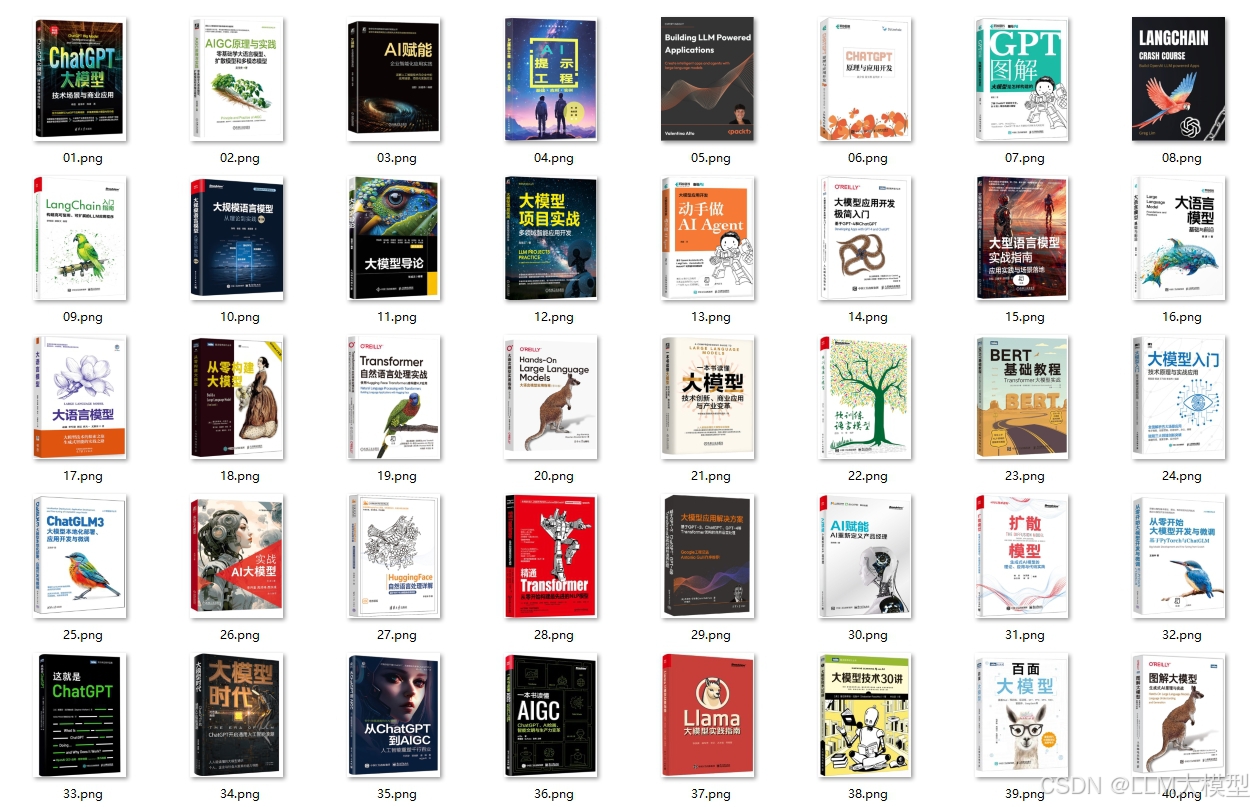
2. 26 份行业研究报告:覆盖多领域实践与趋势
报告包含阿里、DeepSeek 等权威机构发布的核心内容,涵盖:
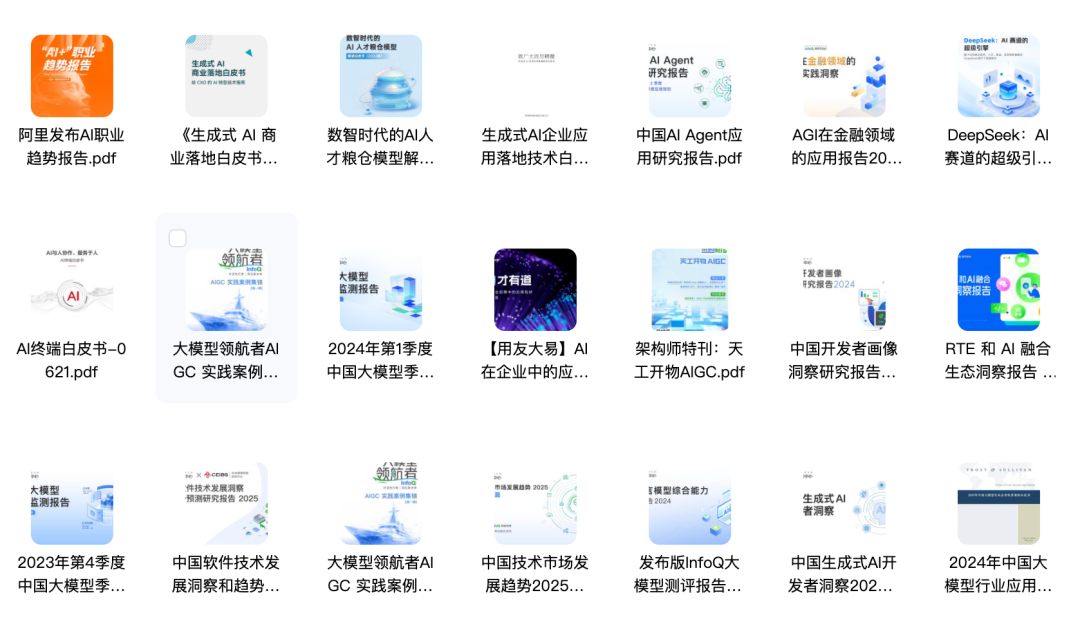
- 职业趋势:《AI + 职业趋势报告》《中国 AI 人才粮仓模型解析》;
- 商业落地:《生成式 AI 商业落地白皮书》《AI Agent 应用落地技术白皮书》;
- 领域细分:《AGI 在金融领域的应用报告》《AI GC 实践案例集》;
- 行业监测:《2024 年中国大模型季度监测报告》《2025 年中国技术市场发展趋势》。
3. 600+套技术大会 PPT:听行业大咖讲实战
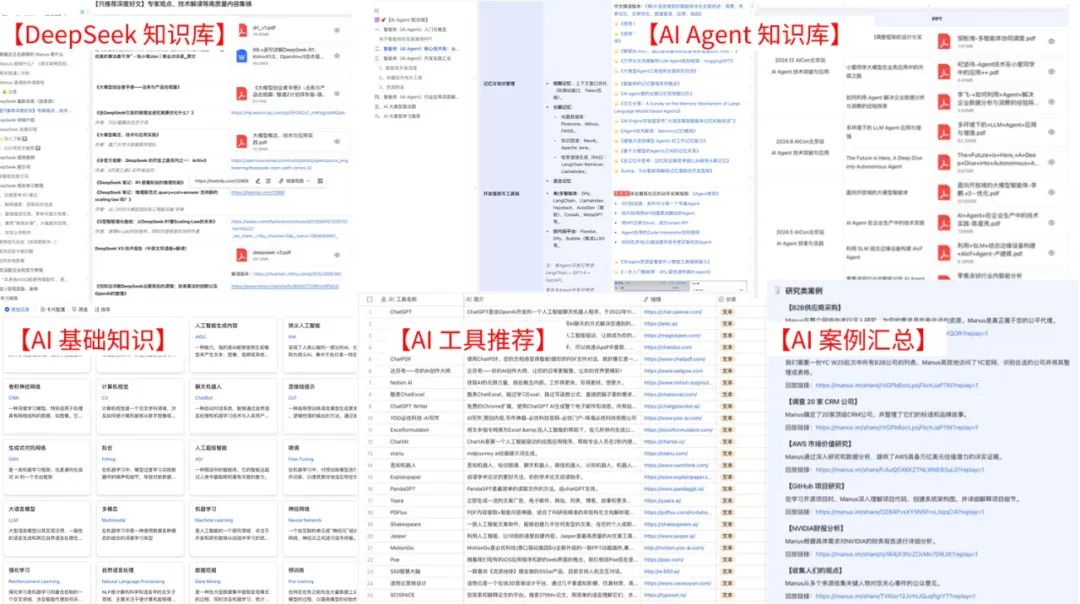
PPT 整理自 2024-2025 年热门技术大会,包含百度、腾讯、字节等企业的一线实践:

- 安全方向:《端侧大模型的安全建设》《大模型驱动安全升级(腾讯代码安全实践)》;
- 产品与创新:《大模型产品如何创新与创收》《AI 时代的新范式:构建 AI 产品》;
- 多模态与 Agent:《Step-Video 开源模型(视频生成进展)》《Agentic RAG 的现在与未来》;
- 工程落地:《从原型到生产:AgentOps 加速字节 AI 应用落地》《智能代码助手 CodeFuse 的架构设计》。
二、求职必看:大厂 AI 岗面试 “弹药库”,300 + 真题 + 107 道面经直接抱走
想冲字节、腾讯、阿里、蔚来等大厂 AI 岗?这份面试资料帮你提前 “押题”,拒绝临场慌!
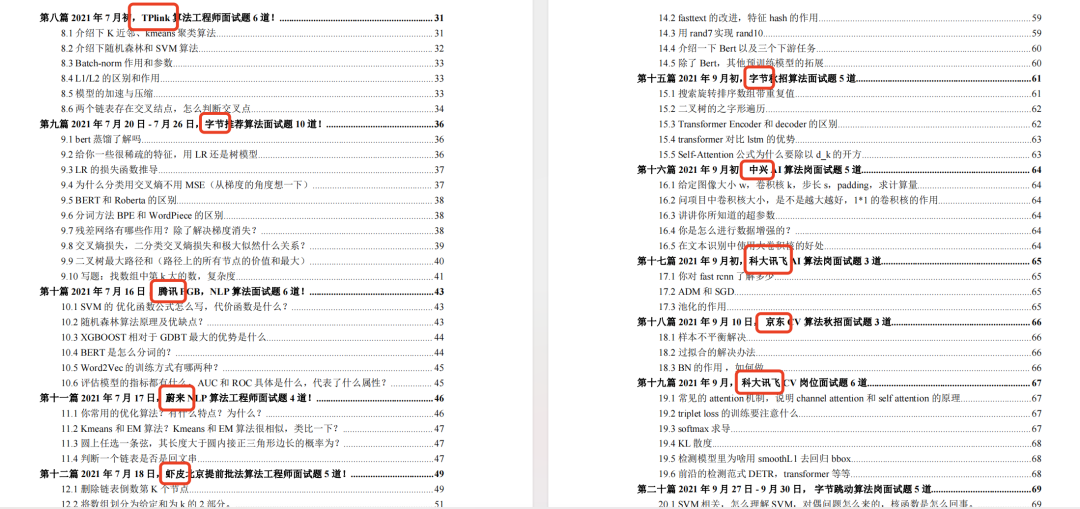
1. 107 道大厂面经:覆盖 Prompt、RAG、大模型应用工程师等热门岗位
面经整理自 2021-2025 年真实面试场景,包含 TPlink、字节、腾讯、蔚来、虾皮、中兴、科大讯飞、京东等企业的高频考题,每道题都附带思路解析:
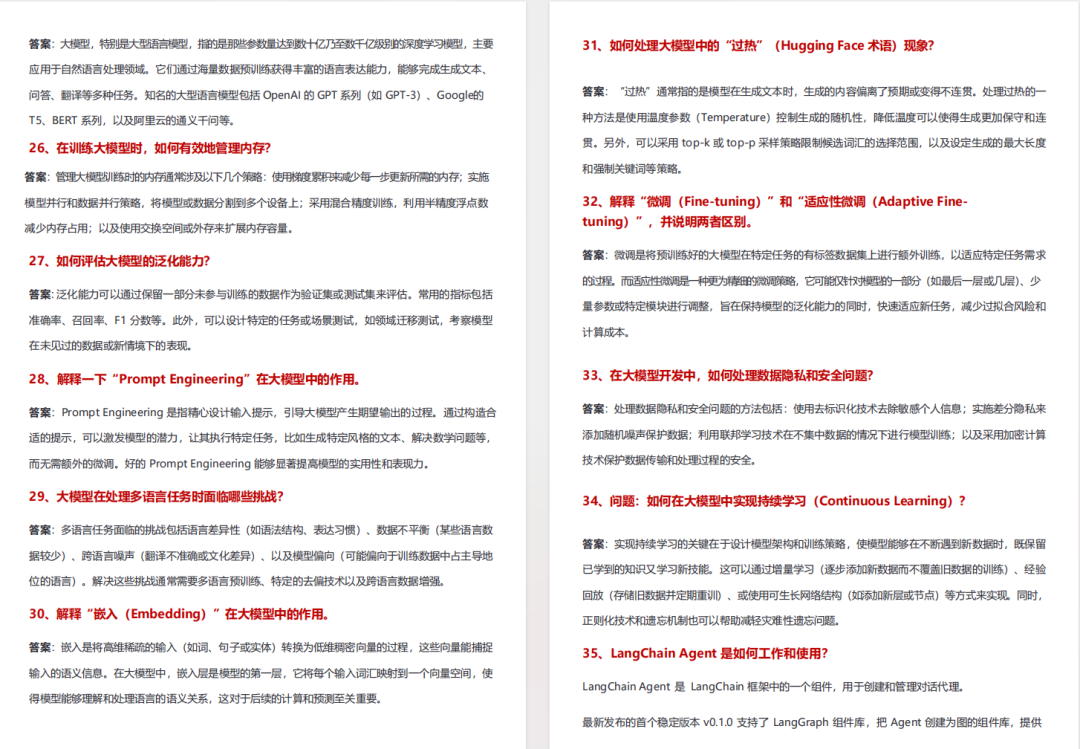
2. 102 道 AI 大模型真题:直击大模型核心考点
针对大模型专属考题,从概念到实践全面覆盖,帮你理清底层逻辑:
3. 97 道 LLMs 真题:聚焦大型语言模型高频问题
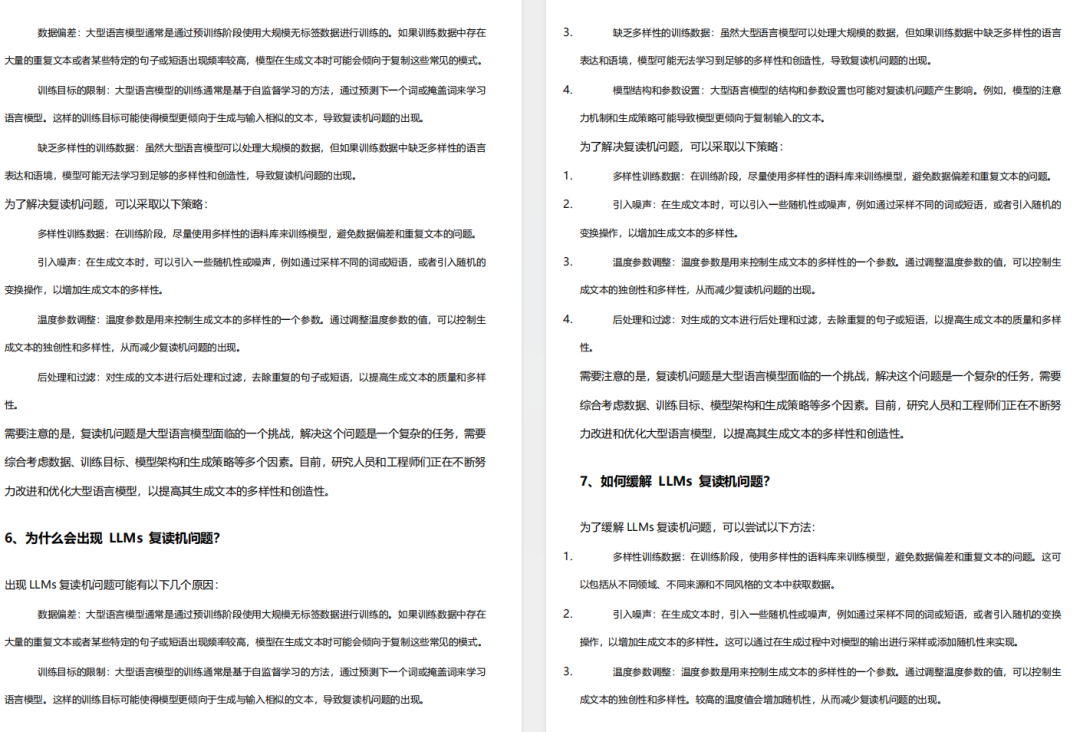
专门拆解 LLMs 的核心痛点与解决方案,比如让很多人头疼的 “复读机问题”:
三、路线必明: AI 大模型学习路线图,1 张图理清核心内容
刚接触 AI 大模型,不知道该从哪学起?这份「AI大模型 学习路线图」直接帮你划重点,不用再盲目摸索!
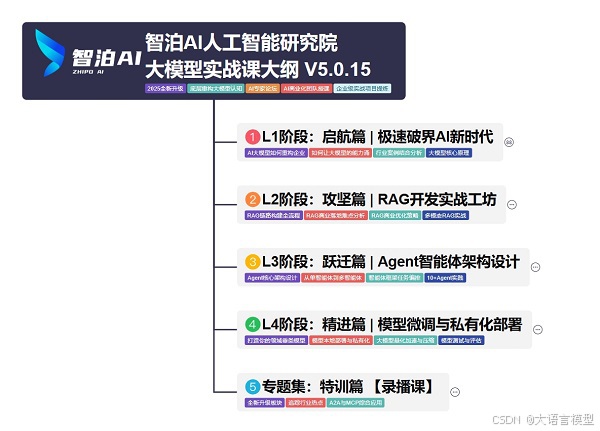
路线图涵盖 5 大核心板块,从基础到进阶层层递进:一步步带你从入门到进阶,从理论到实战。
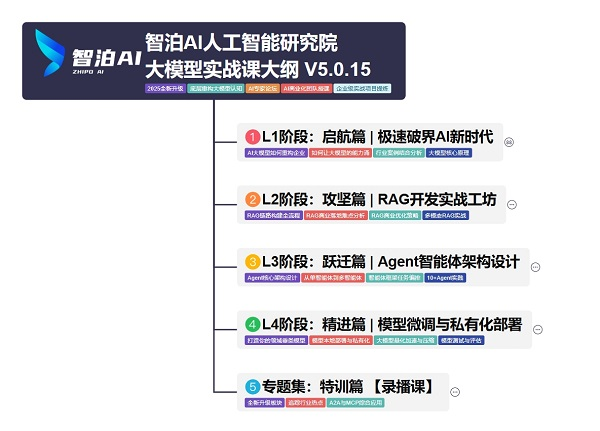
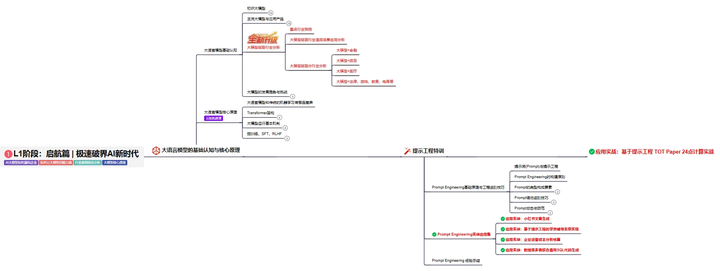
L1阶段:启航篇丨极速破界AI新时代
L1阶段:了解大模型的基础知识,以及大模型在各个行业的应用和分析,学习理解大模型的核心原理、关键技术以及大模型应用场景。
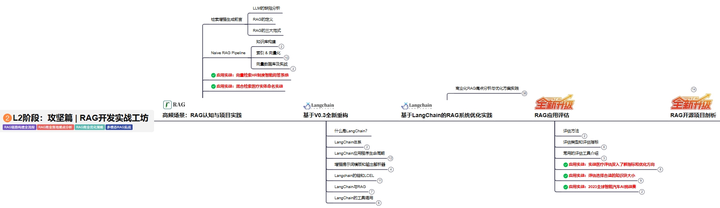
L2阶段:攻坚篇丨RAG开发实战工坊
L2阶段:AI大模型RAG应用开发工程,主要学习RAG检索增强生成:包括Naive RAG、Advanced-RAG以及RAG性能评估,还有GraphRAG在内的多个RAG热门项目的分析。
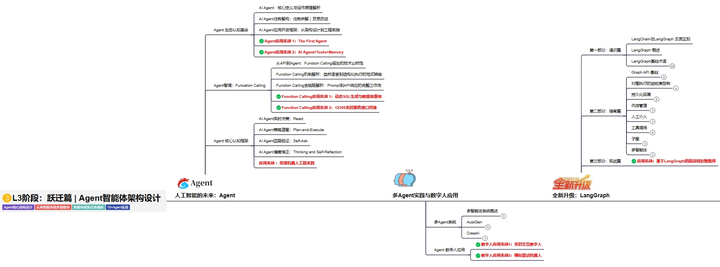
L3阶段:跃迁篇丨Agent智能体架构设计
L3阶段:大模型Agent应用架构进阶实现,主要学习LangChain、 LIamaIndex框架,也会学习到AutoGPT、 MetaGPT等多Agent系统,打造Agent智能体。
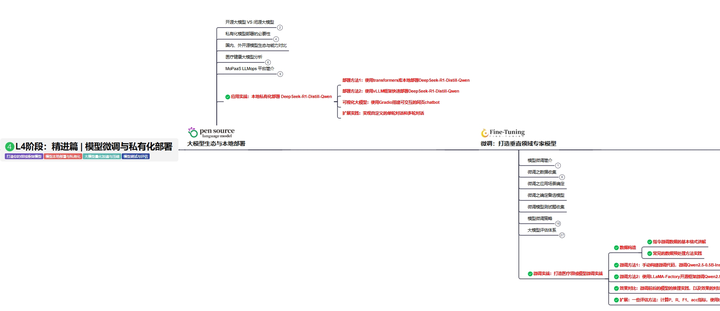
L4阶段:精进篇丨模型微调与私有化部署
L4阶段:大模型的微调和私有化部署,更加深入的探讨Transformer架构,学习大模型的微调技术,利用DeepSpeed、Lamam Factory等工具快速进行模型微调,并通过Ollama、vLLM等推理部署框架,实现模型的快速部署。
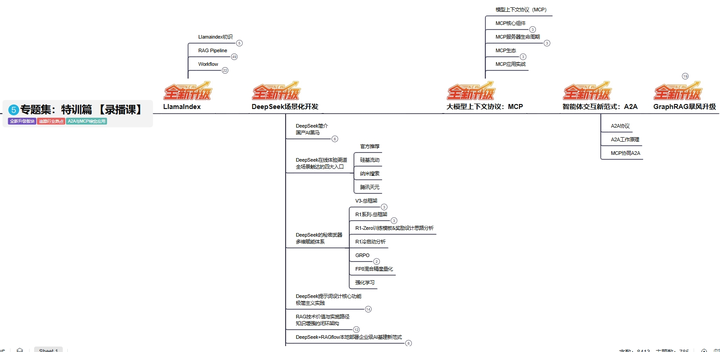
L5阶段:专题集丨特训篇 【录播课】
四、资料领取:全套内容免费抱走,学 AI 不用再找第二份
不管你是 0 基础想入门 AI 大模型,还是有基础想冲刺大厂、了解行业趋势,这份资料都能满足你!
现在只需按照提示操作,就能免费领取:
👇👇扫码免费领取全部内容👇👇
2025 年想抓住 AI 大模型的风口?别犹豫,这份免费资料就是你的 “起跑线”!

魔乐社区(Modelers.cn) 是一个中立、公益的人工智能社区,提供人工智能工具、模型、数据的托管、展示与应用协同服务,为人工智能开发及爱好者搭建开放的学习交流平台。社区通过理事会方式运作,由全产业链共同建设、共同运营、共同享有,推动国产AI生态繁荣发展。
更多推荐


 21
21 0
0- 0


 已为社区贡献218条内容

所有评论(0)