yolov5的数据集图片显示标签代码,颜色代码是按照yolov5官方代码中的
·
yolov5的数据集图片显示标签代码,颜色代码按照是yolov5官方代码中的
读取和显示yolov5格式的数据集
import cv2
import os
from tqdm import tqdm

class Colors:
    # Ultralytics color palette https://ultralytics.com/
    def __init__(self):
        # hex = matplotlib.colors.TABLEAU_COLORS.values()
        hexs = ('FF3838', 'FF9D97', 'FF701F', 'FFB21D', 'CFD231', '48F90A', '92CC17', '3DDB86', '1A9334', '00D4BB',
                '2C99A8', '00C2FF', '344593', '6473FF', '0018EC', '8438FF', '520085', 'CB38FF', 'FF95C8', 'FF37C7')
        self.palette = [self.hex2rgb(f'#{c}') for c in hexs]
        self.n = len(self.palette)

    def __call__(self, i, bgr=False):
        c = self.palette[int(i) % self.n]
        return (c[2], c[1], c[0]) if bgr else c

    @staticmethod
    def hex2rgb(h):  # rgb order (PIL)
        return tuple(int(h[1 + i:1 + i + 2], 16) for i in (0, 2, 4))


colors = Colors()  # create instance for 'from utils.plots import colors'

def draw_box_in_single_image(image_path, txt_path, img_save_path, labels):
    # 读取图像
    image = cv2.imread(image_path)

    # 读取txt文件信息
    def read_list(txt_path):
        pos = []
        with open(txt_path, 'r') as file_to_read:
            while True:
                lines = file_to_read.readline()  # 整行读取数据
                if not lines:
                    break
                    pass
                # 将整行数据分割处理,如果分割符是空格,括号里就不用传入参数,如果是逗号, 则传入‘,'字符。
                p_tmp = [float(i) for i in lines.split(' ')]
                pos.append(p_tmp)  # 添加新读取的数据
                # Efield.append(E_tmp)
                pass
        return pos


    # txt转换为box
    def convert(size, box):
        xmin = (box[1]-box[3]/2.)*size[1]
        xmax = (box[1]+box[3]/2.)*size[1]
        ymin = (box[2]-box[4]/2.)*size[0]
        ymax = (box[2]+box[4]/2.)*size[0]
        box = (int(xmin), int(ymin), int(xmax), int(ymax))
        return box

    pos = read_list(txt_path)
    # tl = max(round((image.shape[0]+image.shape[1])/2 * 0.003), 2)
    # lf = max(tl-1, 1)
    for i in range(len(pos)):
        # label = str(int(pos[i][0]))
        label = labels[int(pos[i][0])]     # 标签序号
        # conf = f'{ pos[i][5]:.2f}'
        box = convert(image.shape, pos[i]) # xywh ——> xyxy
        p1, p2 = (box[0], box[1]),(box[2],box[3]) # p1左上角坐标、p2右下角坐标
        w, h = cv2.getTextSize(label, 0, fontScale=1, thickness=2)[0] # 标签文字的宽和高
        # w, h = cv2.getTextSize(str(label) + str(conf), 0, fontScale=1, thickness=2)[0] # 如果还需要显示置信度
        outside = p1[1] - h >=3     # 预测框的box(1)离图片的距离是否能够让标签可以写下
        p2 = p1[0] + w, p1[1] - h - 3 if outside else p1[1] + h + 3  # outside为True时, p1为左下角坐标, p2为右上角坐标 outside为False时, p1为左上角坐标, p2为右下角坐标
        cv2.rectangle(image, p1, p2, colors(int(pos[i][0]), True), -1, cv2.LINE_AA)  # filled  # p1 直线起点坐标 p2 直线终点坐标(并不是说p1一定是左上角坐标, p2一定是右下角坐标)
        image = cv2.rectangle(image,(box[0], box[1]),(box[2],box[3]),colors(int(pos[i][0]), True),1)
        cv2.putText(image, str(label), (p1[0], p1[1] - 2 if outside else p1[1] + h + 2), 0, 1, (255, 255, 255), thickness=2, lineType=cv2.LINE_AA)  # 坐标是文本左下角的坐标
        # 需要显示置信度
        # cv2.putText(image, str(label) + str(conf), (p1[0], p1[1] - 2 if outside else p1[1] + h + 2), 0, 1, (255, 255, 255), thickness=3, lineType=cv2.LINE_AA)
        pass

    # # plot figure
    # cv2.imshow("images", image)
    # cv2.waitKey(0)
    # cv2.destroyAllWindows()

    # img_save
    cv2.imwrite(img_save_path, image)


if __name__ == '__main__':
    img_folder = "./val/images"
    img_list = os.listdir(img_folder)
    img_list.sort()

    label_folder = "./val/labels"
    label_list = os.listdir(label_folder)
    label_list.sort()

    img_save_folder = './val/img_save'
    if not os.path.exists(img_save_folder):
        os.makedirs(img_save_folder)

    labels = {0: 'flame', 1: 'smoke'}

    for i in tqdm(range(len(img_list))):
        image_path = img_folder + "/" + img_list[i]
        txt_path = label_folder + "/" + label_list[i]
        img_save_path = img_save_folder + "/" + img_list[i]
        draw_box_in_single_image(image_path, txt_path, img_save_path, labels)
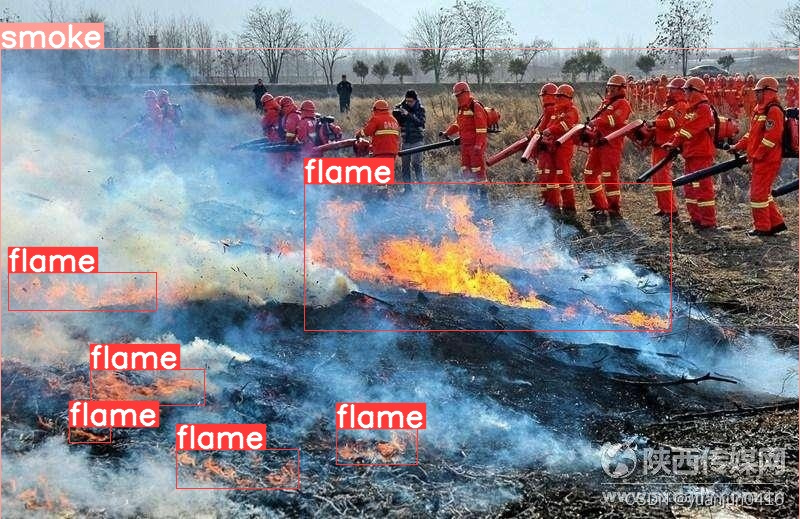
显示结果

魔乐社区(Modelers.cn) 是一个中立、公益的人工智能社区,提供人工智能工具、模型、数据的托管、展示与应用协同服务,为人工智能开发及爱好者搭建开放的学习交流平台。社区通过理事会方式运作,由全产业链共同建设、共同运营、共同享有,推动国产AI生态繁荣发展。
更多推荐


 13
13 0
0- 0


 已为社区贡献4条内容

所有评论(0)