matlab——legend的使用
图例位置设置
Matlab中legend默认的位置在NorthEast,如图所示:
%Matlab中legend的位置设置 默认在右上方

clc
clear
close all
Npoint = 100;
x = linspace(0,4*pi,Npoint);
y1 = sin(x);
y2 = cos(x);
H = plot(x,y1,x,y2);
legend('sin(x)','cos(x)');
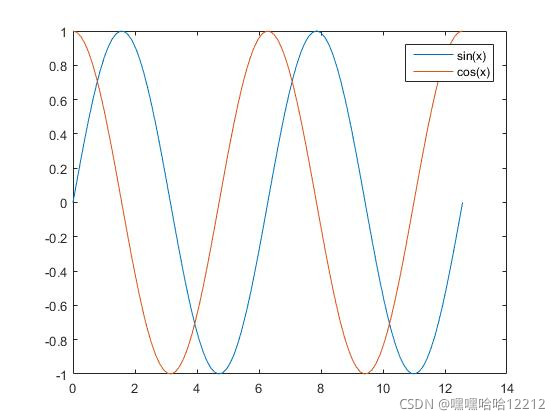
可以通过Location对legend的位置进行改变,变为North,如图所示:
%Matlab中legend的位置设置

clc
clear
close all
Npoint = 100;
x = linspace(0,4*pi,Npoint);
y1 = sin(x);
y2 = cos(x);
H = plot(x,y1,x,y2);
legend('sin(x)','cos(x)','Location','North');
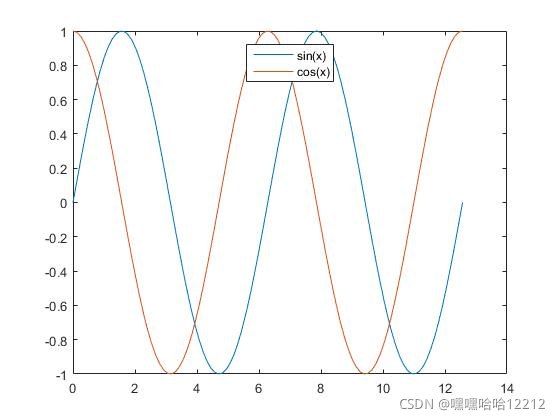
Matlab中有许多位置可以选择:
‘North’ inside plot box near top
‘South’ inside bottom
‘East’ inside right
‘West’ inside left
‘NorthEast’ inside top right (default for 2-D plots)
‘NorthWest’ inside top left
‘SouthEast’ inside bottom right
‘SouthWest’ inside bottom left
‘NorthOutside’ outside plot box near top
‘SouthOutside’ outside bottom
‘EastOutside’ outside right
‘WestOutside’ outside left
‘NorthEastOutside’ outside top right (default for 3-D plots)
‘NorthWestOutside’ outside top left
‘SouthEastOutside’ outside bottom right
‘SouthWestOutside’ outside bottom left
‘Best’ least conflict with data in plot
‘BestOutside’ least unused space outside plot
Matlab中还可以选择某条曲线legend的指定显示:
clc
clear
close all
Npoint = 101;
x = linspace(0,10,Npoint);
y1 = besselj(1,x);
y2 = besselj(2,x);
y3 = besselj(3,x);
y4 = besselj(4,x);
y5 = besselj(5,x);
H = plot(x,y1,x,y2,x,y3,x,y4,x,y5);
legend('First','Second','Third','Fourth','Fifth','Location','NorthEastOutside')
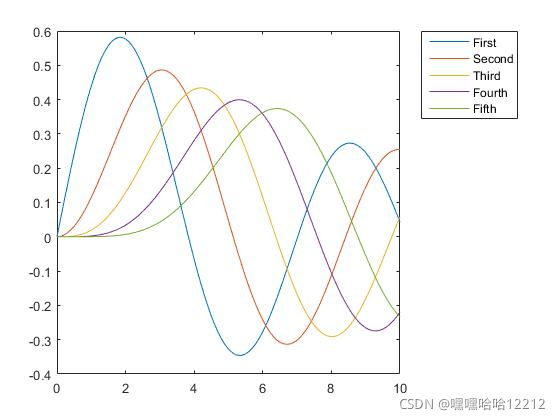
如果只想显示第1、3、5条,也很简单:
%Matlab中legend的选择

clc
clear
close all
Npoint = 101;
x = linspace(0,10,Npoint);
y1 = besselj(1,x);
y2 = besselj(2,x);
y3 = besselj(3,x);
y4 = besselj(4,x);
y5 = besselj(5,x);
H = plot(x,y1,x,y2,x,y3,x,y4,x,y5);
h1 = legend(H([1 3 5]),'First','Third','Fifthth','Location','NorthEastOutside')
%Matlab中legend的横排,注意,Location位置改变为North

clc
clear
close all
Npoint = 101;
x = linspace(0,10,Npoint);
y1 = besselj(1,x);
y2 = besselj(2,x);
y3 = besselj(3,x);
y4 = besselj(4,x);
y5 = besselj(5,x);
H = plot(x,y1,x,y2,x,y3,x,y4,x,y5);
h1 = legend(H([1 3 5]),'First','Third','Fifthth','Location','North');
set(h1,'Orientation','horizon')
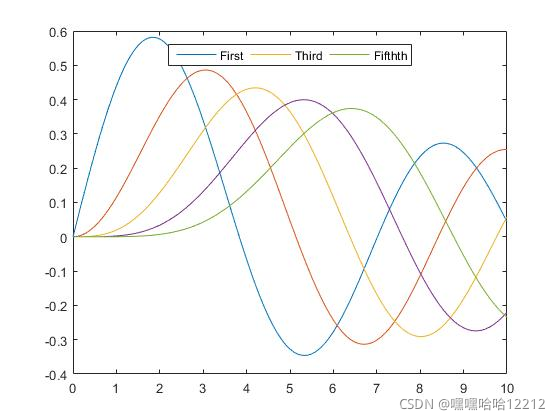
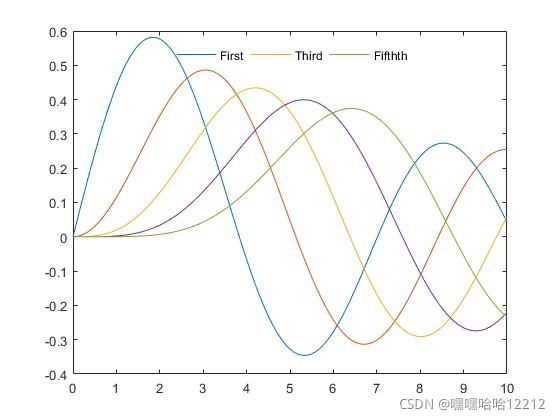
不显示方框的图例
clc
clear
close all
Npoint = 101;
x = linspace(0,10,Npoint);
y1 = besselj(1,x);
y2 = besselj(2,x);
y3 = besselj(3,x);
y4 = besselj(4,x);
y5 = besselj(5,x);
H = plot(x,y1,x,y2,x,y3,x,y4,x,y5);
h1 = legend(H([1 3 5]),'First','Third','Fifthth','Location','North');
set(h1,'Orientation','horizon','Box','off')

魔乐社区(Modelers.cn) 是一个中立、公益的人工智能社区,提供人工智能工具、模型、数据的托管、展示与应用协同服务,为人工智能开发及爱好者搭建开放的学习交流平台。社区通过理事会方式运作,由全产业链共同建设、共同运营、共同享有,推动国产AI生态繁荣发展。
更多推荐


 13
13 0
0- 0


 已为社区贡献1条内容

所有评论(0)