matlab 获得gca,【 MATLAB 】gca 介绍(当前轴或图表)
gca
Current axes or chart
Syntax
ax = gca
Description
ax = gca returns the current axes or chart for the current figure, which is typically the last one created or clicked with the mouse.
ax = gca 返回当前图形的当前轴或图表,通常是用鼠标创建或单击的最后一个轴。
Graphics functions, such as title, target the current axes or chart. Use ax to access and modify properties of the axes or chart. If axes or charts do not exist, then gca creates Cartesian axes.
图形功能(例如标题)以当前轴或图表为目标。 使用ax访问和修改轴或图表的属性。 如果轴或图表不存在,则gca创建笛卡尔坐标轴。
Specify Properties for Current Axes
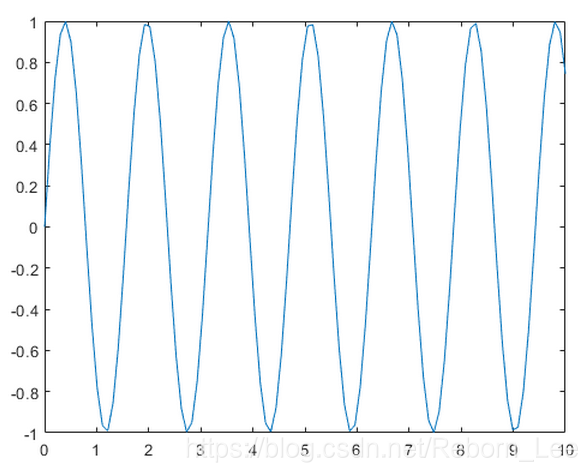
Plot a sine wave.
x = linspace(0,10);
y = sin(4*x);
plot(x,y)
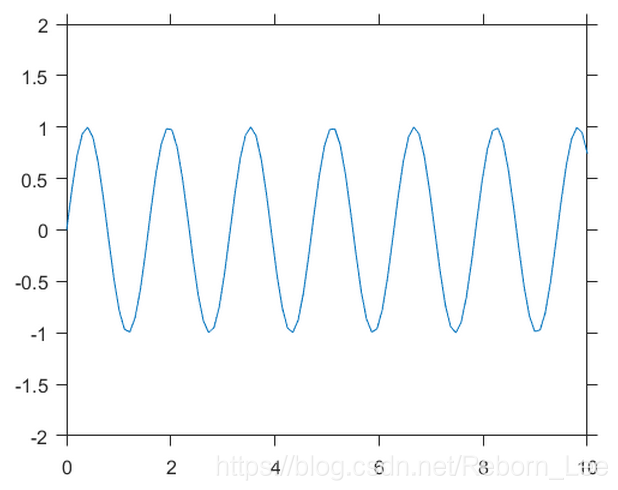
Set the font size, tick direction, tick length, and y-axis limits for the current axes. Use gca to refer to the current axes.
Note: Starting in R2014b, you can use dot notation to set properties. If you are using an earlier release, use the docid:matlab_ref.f67-432995 function instead, such as set(ax,'FontSize',12).
ax = gca; % current axes
ax.FontSize = 12;
ax.TickDir = 'out';
ax.TickLength = [0.02 0.02];
ax.YLim = [-2 2];
Tips
User interaction can change the current axes or chart. It is better to assign the axes or chart to a variable when you create it instead of relying on gca.
用户交互可以更改当前轴或图表。 最好在创建变量时将轴或图表分配给变量,而不是依赖于gca。
Changing the current figure also changes the current axes or chart.
更改当前图形也会更改当前轴或图表。
Set axes properties after plotting since some plotting functions reset axes properties.
绘图后设置轴属性,因为某些绘图功能会重置轴属性。
To access the current axes or chart without forcing the creation of Cartesian axes, query the figure CurrentAxes property. MATLAB® returns an empty array if there is no current axes.
要在不强制创建笛卡尔坐标轴的情况下访问当前轴或图表,请查询图形CurrentAxes属性。 如果没有当前轴,MATLAB®将返回一个空数组。 fig = gcf; ax = fig.CurrentAxes;Starting in R2014b, you can query properties using dot notation. If you are using an earlier release, use the get function instead, such as ax = get(fig,'CurrentAxes').
从R2014b开始,您可以使用点表示法查询属性。 如果您使用的是早期版本,请改用get函数,例如ax = get(fig,'CurrentAxes').
上例中,如果加入语句:
fig = gcf; ax = fig.CurrentAxes;
则得到:
ax =
Axes - 属性:
XLim: [0 2]
YLim: [-100 20]
XScale: 'linear'
YScale: 'linear'
GridLineStyle: '-'
Position: [0.1300 0.1100 0.7750 0.8150]
Units: 'normalized'
本文同步分享在 博客“李锐博恩”(CSDN)。
如有侵权,请联系 support@oschina.cn 删除。
本文参与“OSC源创计划”,欢迎正在阅读的你也加入,一起分享。

魔乐社区(Modelers.cn) 是一个中立、公益的人工智能社区,提供人工智能工具、模型、数据的托管、展示与应用协同服务,为人工智能开发及爱好者搭建开放的学习交流平台。社区通过理事会方式运作,由全产业链共同建设、共同运营、共同享有,推动国产AI生态繁荣发展。
更多推荐


 0
0 0
0- 0


 已为社区贡献2条内容

所有评论(0)