vue3实现echarts饼图自定义展示
·
效果:
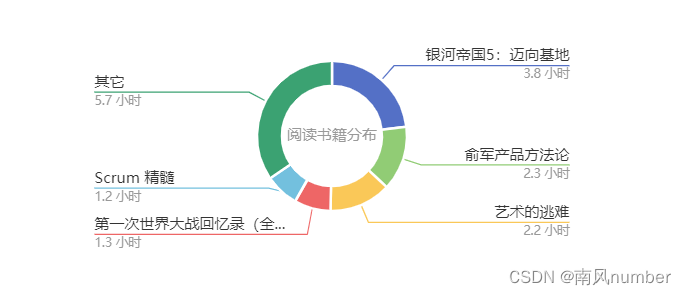
首先安装 echarts
npm install -S echarts
在需要的页面使用
<script lang="ts" setup>
import { ref, onMounted } from "vue";
//  按需引入 echarts
import * as echarts from "echarts";
const main = ref(); // 使用ref创建虚拟DOM引用,使用时用main.value
onMounted(() => {
  init();
});
function init() {
  // 基于准备好的dom,初始化echarts实例
  var myChart = echarts.init(main.value);
  var datas = [
    [
      { name: "银河帝国5:迈向基地", value: 3.8 },
      { name: "俞军产品方法论", value: 2.3 },
      { name: "艺术的逃难", value: 2.2 },
      { name: "第一次世界大战回忆录(全五卷)", value: 1.3 },
      { name: "Scrum 精髓", value: 1.2 },
      { name: "其它", value: 5.7 },
    ],
  ];
  // 指定图表的配置项和数据
  var option = {
    title: {
      text: "阅读书籍分布",
      left: "center",
      top: "center",
      textStyle: {
        color: "#999",
        fontWeight: "normal",
        fontSize: 12,
      },
    },
    series: datas.map(function (data) {
      return {
        type: "pie",
        radius: [40, 60],
        height: "33.33%",
        left: "center",
        top: "center",
        width: 400,
        itemStyle: {
          borderColor: "#fff",
          borderWidth: 2,
        },
        label: {
          alignTo: "edge",
          formatter: "{name|{b}}\n{time|{c} 小时}",
          minMargin: 5,
          edgeDistance: 10,
          lineHeight: 15,
          rich: {
            time: {
              fontSize: 10,
              color: "#999",
            },
          },
        },
        labelLine: {
          length: 15,
          length2: 0,
          maxSurfaceAngle: 80,
        },
        labelLayout: function (params: any) {
          const isLeft = params.labelRect.x < myChart.getWidth() / 2;
          const points = params.labelLinePoints;
          // Update the end point.
          points[2][0] = isLeft
            ? params.labelRect.x
            : params.labelRect.x + params.labelRect.width;
          return {
            labelLinePoints: points,
          };
        },
        data: data,
      };
    }),
  };
  // 使用刚指定的配置项和数据显示图表。
  myChart.setOption(option);
}
</script>

<template>
  <div ref="main" style="width: 100%; height: 400px"></div>
</template>

<style scoped></style>

魔乐社区(Modelers.cn) 是一个中立、公益的人工智能社区,提供人工智能工具、模型、数据的托管、展示与应用协同服务,为人工智能开发及爱好者搭建开放的学习交流平台。社区通过理事会方式运作,由全产业链共同建设、共同运营、共同享有,推动国产AI生态繁荣发展。
更多推荐


 1
1 0
0- 0


 已为社区贡献1条内容

所有评论(0)