vue EChaets 树图 改变节点的颜色
·
EChaets 树图 改变节点的颜色
效果图: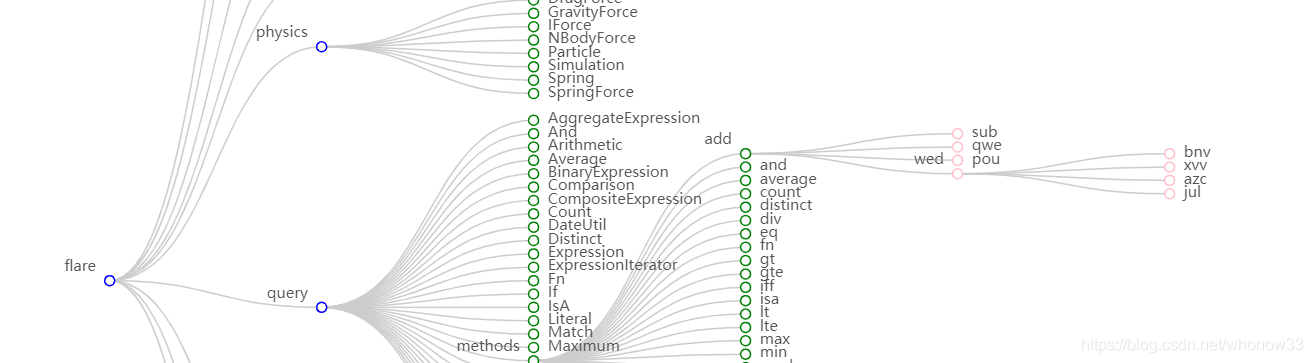
代码:
export default {
  name: 'TreeChart',
  data() {
    return {
    	//定义一个颜色数组
      colorSet: ['blue', 'green', 'pink', 'grey', 'orange', 'yellow', 'purple'],
      //一个全局的数组
      Arr: [],
    }
  },
处理数据的方法:
    chartDetail(chartData, floor) {
      for (var i = 0; i < chartData.length; i++) {
        // 遍历节点添加itemStyle属性
        chartData[i].itemStyle = {
        //Math.floor(floor / 2)实现的效果为,每两个节点为一个颜色的这样一个效果。
          borderColor: this.colorSet[Math.floor(floor / 2)],
        }
        if (chartData[i].children && chartData[i].children.length > 0) {
          this.chartDetail(chartData[i].children, floor + 1) //如果有孩子节点便继续递归遍历
        }
      }
    },
  },
  mounted() {
    //charData数据使用的是ECharts官网树图例子接口数据
    console.log(this.chartData, 'chartData')
    //JSON方法实现深拷贝:先转为JSON字符串,再转为原生JS对象
    this.Arr = JSON.parse(JSON.stringify(this.chartData))
    console.log(this.Arr, 'Arr')
    //Arr为深复制之后的数据,作为参数传给chartDetail()这个方法,进行数据处理,并传一个floor为0
    this.chartDetail(this.Arr, 0)
    this.drawTree(this.Arr)
  },
画图的方法:
    drawTree(Arr) {
      let myChart = this.$echarts.init(this.$refs.treeChart)
      var option = {
        tooltip: {
          trigger: 'item',
          triggerOn: 'mousemove',
        },
        series: [
          {
            type: 'tree',
            data: Arr,

            top: '1%',
            left: '7%',
            bottom: '1%',
            right: '20%',

            symbolSize: 10,

            label: {
              position: 'insideLeft ',
              offset: [-8, -8],
              //文字垂直对齐方式
              verticalAlign: 'middle',
              //文字水平对齐方式
              align: 'right',
              fontSize: 15,
              rich: {
                a: {
                  color: 'red',
                  lineHeight: 10,
                },
              },
            },
            //叶子节点
            leaves: {
              label: {
                position: 'insideRight ',
                //是否对文字进行偏移
                offset: [20, 5],
                verticalAlign: 'middle',
                align: 'rifht',
              },
              // itemStyle: {
              //   borderColor: this.itemColor,
              // },
            },
            symbol: 'emptyCircle',
            //树图边的样式
            lineStyle: {
              color: '#cccccc',
              //树图边的曲度
              curveness: '0.5',
            },
            // itemStyle: {
            //   //每个节点得颜色
            //   borderColor: this.itemColor,
            // },

            expandAndCollapse: true,
            animationDuration: 550,
            animationDurationUpdate: 750,
          },
        ],
      }
      myChart.setOption(option)
    },

魔乐社区(Modelers.cn) 是一个中立、公益的人工智能社区,提供人工智能工具、模型、数据的托管、展示与应用协同服务,为人工智能开发及爱好者搭建开放的学习交流平台。社区通过理事会方式运作,由全产业链共同建设、共同运营、共同享有,推动国产AI生态繁荣发展。
更多推荐


 1
1 0
0- 0


 已为社区贡献1条内容

所有评论(0)