echart vue 嵌套饼图_vue2.0实现echarts饼图(pie)效果展示
最近做的项目需要饼状图展示数据的功能,于是便引入echarts做了一个饼状图的效果展示。由于只用到echarts其中的饼图,所以就单独在需要的模块引用,避免全局引用影响性能,减少不必要的加载。一.使用 cnpm 安装 Echartscnpm install echarts -S二.HTML部分课程分布图(部门统计,岗位统计,人员统计,分类统计,类型统计)三.CSS部分.echarts-conten
最近做的项目需要饼状图展示数据的功能,于是便引入echarts做了一个饼状图的效果展示。由于只用到echarts其中的饼图,所以就单独在需要的模块引用,避免全局引用影响性能,减少不必要的加载。
一.使用 cnpm 安装 Echartscnpm install echarts -S
二.HTML部分
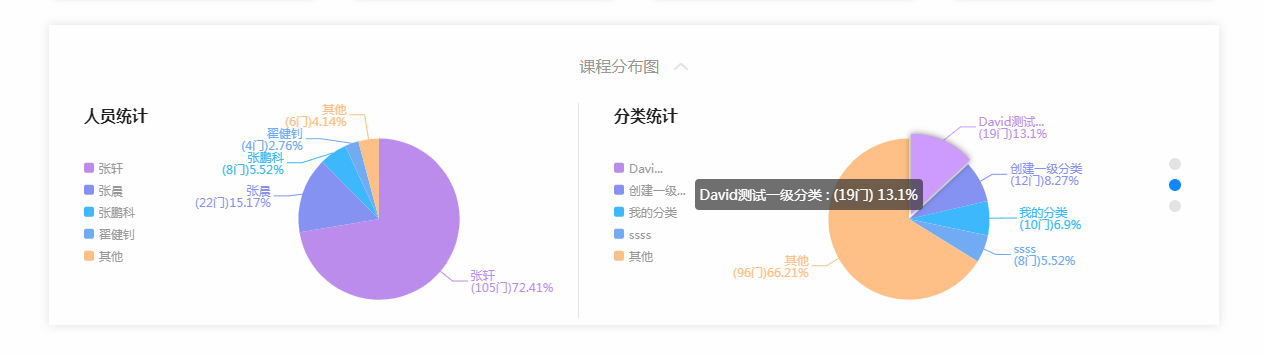
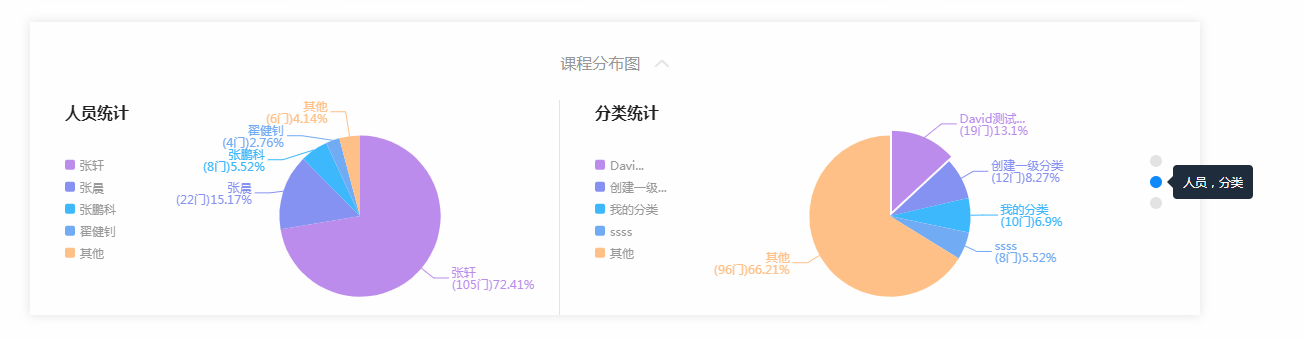
课程分布图
(部门统计,岗位统计,人员统计,分类统计,类型统计)
三.CSS部分.echarts-content{
width:100%;
min-height:78px;
max-height:300px;
background:#fff;
-webkit-box-shadow: 0 0 15px rgba(0,0,0,.1);
-moz-box-shadow: 0 0 15px rgba(0,0,0,.1);
box-shadow: 0 0 15px rgba(0,0,0,.1);
padding:0 30px;
}
.echarts-content .chart-head{
height:78px;
width:100%;
padding-top:30px;
}
.echarts-content .chart-head p{
display:inline-block;
height:21px;
width:100%;
cursor:pointer;
text-align:center;
}
.echarts-content .chart-head p strong{
font-weight:normal;
font-size:16px;
color:#999;
}
.echarts-content .chart-head p em{
display:inline-block;
font-style:normal;
font-size:14px;
color:#999;
}
.echarts-content .chart-head p i{
display:inline-block;
color:#e4e4e4;
font-size: 14px;
margin-left:10px;
}
.echarts-content .chart-main{
width:100%;
height:222px;
position: relative;
overflow: hidden;
-webkit-transition: height 0.6s;
-moz-transition: height 0.6s;
-o-transition: height 0.6s;
transition: height 0.6s;
}
.echarts-content .chart-main .chart-main-left{
width:calc(100% - 20px);
height:100%;
float:left;
}
.echarts-content .chart-main .chart-main-right{
width:20px;
height:100%;
float:right;
padding-top:50px;
}
.echarts-content .chart-main .chart-main-right span{
display:inline-block;
width:12px;
height:12px;
background:#e4e4e4;
border-radius:100%;
-moz-border-radius: 100%;
-webkit-border-radius: 100%;
cursor:pointer;
}
.echarts-content .chart-main .chart-main-right span:hover{
background:#0188fd;
}
.echarts-content .chart-main .chart-main-right .spanActive{
background:#0188fd;
}
四.JS部分// 引入基本模板
let echarts = require('echarts/lib/echarts');
// 引入饼图组件
require('echarts/lib/chart/pie');
// 引入提示框和图例组件
require('echarts/lib/component/title');
require('echarts/lib/component/tooltip');
require('echarts/lib/component/legend');
require("echarts/lib/component/legendScroll");
export default {
data() {
return {
departmentOption:{
title : {
text: '部门统计',
subtext: '',
x:'left',
textStyle:{
color:"#222",
fontStyle:"normal",
fontWeight:"600",
fontFamily:"san-serif",
fontSize:16,
}
},
tooltip : {
trigger: 'item',
/* formatter: "{a}
{b} : ({c}门) {d}%"*/
formatter: "{a} {b} : ({c}门) {d}%"
},
legend: {
x : '70%',
y : '25%',
orient: 'vertical',
left: 'left',
itemWidth:10,
itemHeight:10,
selectedMode:false, //禁止点击
textStyle: {
fontSize: 12,
color:"#999",
},
formatter: function (name) { //避免文字太长做省略处理
return name.length > 4 ? (name.slice(0,4)+"...") : name
},
data: []
},
series : [
{
name: '',
type: 'pie',
radius : '75%',
center: ['60%', '54%'],
hoverAnimation:false, //是否开启 hover 在扇区上的放大动画效果
selectedMode:'single', //选中模式,表示是否支持多个选中,默认关闭,支持布尔值和字符串,字符串取值可选'single','multiple',分别表示单选还是多选。
selectedOffset:5, //选中扇区的偏移距离
data:[],
itemStyle: {
normal:{
label:{
show:true,
textStyle: {
fontSize: 12
},
/* formatter: '{b} : ({c}门) \n {d}%'*/
formatter: function(params){ //避免文字太长做省略处理
var name=params.name; //名字
var percent=params.percent; //占比
var value=params.value; //数量
if(name.length>8){
return name.slice(0,7)+"..."+"\n"+"("+value+"门)"+percent+"%";
}else{
return name+"\n"+"("+value+"门)"+percent+"%";
}
}
},
labelLine:{
show:true
}
},
emphasis: {
shadowBlur: 10,
shadowOffsetX: 0,
shadowColor: 'rgba(0, 0, 0, 0.5)'
}
}
}
],
color: ['rgb(187,140,238)','rgb(134,146,243)','rgb(60,184,255)','rgb(113,171,246)','rgb(255,193,134)'] //饼图分块颜色设置
},
postChartOption:{
title : {
text: '岗位统计',
subtext: '',
x:'left',
textStyle:{
color:"#222",
fontStyle:"normal",
fontWeight:"600",
fontFamily:"san-serif",
fontSize:16,
}
},
tooltip : {
trigger: 'item',
formatter: "{a} {b} : ({c}门) {d}%"
},
legend: {
x : '70%',
y : '25%',
orient: 'vertical',
left: 'left',
itemWidth:10,
itemHeight:10,
selectedMode:false, //禁止点击
textStyle: {
fontSize: 12,
color:"#999",
},
formatter: function (name) {
return name.length > 4 ? (name.slice(0,4)+"...") : name
},
data: []
},
series : [
{
name: '',
type: 'pie',
radius : '75%',
center: ['60%', '54%'],
hoverAnimation:false, //是否开启 hover 在扇区上的放大动画效果
selectedMode:'single', //选中模式,表示是否支持多个选中,默认关闭,支持布尔值和字符串,字符串取值可选'single','multiple',分别表示单选还是多选。
selectedOffset:5, //选中扇区的偏移距离
data:[],
itemStyle: {
normal:{
label:{
show:true,
formatter: function(params){
var name=params.name; //名字
var percent=params.percent; //占比
var value=params.value; //数量
if(name.length>8){
return name.slice(0,7)+"..."+"\n"+"("+value+"门)"+percent+"%";
}else{
return name+"\n"+"("+value+"门)"+percent+"%";
}
}
},
labelLine:{
show:true
}
},
emphasis: {
shadowBlur: 10,
shadowOffsetX: 0,
shadowColor: 'rgba(0, 0, 0, 0.5)'
}
}
}
],
color: ['rgb(187,140,238)','rgb(134,146,243)','rgb(60,184,255)','rgb(113,171,246)','rgb(255,193,134)']
},
personnelChartOption:{
title : {
text: '人员统计',
subtext: '',
x:'left',
textStyle:{
color:"#222",
fontStyle:"normal",
fontWeight:"600",
fontFamily:"san-serif",
fontSize:16,
}
},
tooltip : {
trigger: 'item',
formatter: "{a} {b} : ({c}门) {d}%"
},
legend: {
x : '70%',
y : '25%',
orient: 'vertical',
left: 'left',
itemWidth:10,
itemHeight:10,
selectedMode:false, //禁止点击
textStyle: {
fontSize: 12 ,
color:"#999",
},
formatter: function (name) {
return name.length > 4 ? (name.slice(0,4)+"...") : name
},
data: []
},
series : [
{
name: '',
type: 'pie',
radius : '75%',
center: ['60%', '54%'],
hoverAnimation:false, //是否开启 hover 在扇区上的放大动画效果
selectedMode:'single', //选中模式,表示是否支持多个选中,默认关闭,支持布尔值和字符串,字符串取值可选'single','multiple',分别表示单选还是多选。
selectedOffset:5, //选中扇区的偏移距离
data:[],
itemStyle: {
normal:{
label:{
show:true,
formatter: function(params){
var name=params.name; //名字
var percent=params.percent; //占比
var value=params.value; //数量
if(name.length>8){
return name.slice(0,7)+"..."+"\n"+"("+value+"门)"+percent+"%";
}else{
return name+"\n"+"("+value+"门)"+percent+"%";
}
}
},
labelLine:{
show:true
}
},
emphasis: {
shadowBlur: 10,
shadowOffsetX: 0,
shadowColor: 'rgba(0, 0, 0, 0.5)'
}
}
}
],
color: ['rgb(187,140,238)','rgb(134,146,243)','rgb(60,184,255)','rgb(113,171,246)','rgb(255,193,134)']
},
classifyChartOption:{
title : {
text: '分类统计',
subtext: '',
x:'left',
textStyle:{
color:"#222",
fontStyle:"normal",
fontWeight:"600",
fontFamily:"san-serif",
fontSize:16,
}
},
tooltip : {
trigger: 'item',
formatter: "{a} {b} : ({c}门) {d}%"
},
legend: {
x : '70%',
y : '25%',
orient: 'vertical',
left: 'left',
itemWidth:10,
itemHeight:10,
selectedMode:false, //禁止点击
textStyle: {
fontSize: 12,
color:"#999",
},
formatter: function (name) {
return name.length > 4 ? (name.slice(0,4)+"...") : name
},
data: []
},
series : [
{
name: '',
type: 'pie',
radius : '75%',
center: ['60%', '54%'],
hoverAnimation:false, //是否开启 hover 在扇区上的放大动画效果
selectedMode:'single', //选中模式,表示是否支持多个选中,默认关闭,支持布尔值和字符串,字符串取值可选'single','multiple',分别表示单选还是多选。
selectedOffset:5, //选中扇区的偏移距离
data:[],
itemStyle: {
normal:{
label:{
show:true,
formatter: function(params){
var name=params.name; //名字
var percent=params.percent; //占比
var value=params.value; //数量
if(name.length>8){
return name.slice(0,7)+"..."+"\n"+"("+value+"门)"+percent+"%";
}else{
return name+"\n"+"("+value+"门)"+percent+"%";
}
}
},
labelLine:{
show:true
}
},
emphasis: {
shadowBlur: 10,
shadowOffsetX: 0,
shadowColor: 'rgba(0, 0, 0, 0.5)'
}
}
}
],
color: ['rgb(187,140,238)','rgb(134,146,243)','rgb(60,184,255)','rgb(113,171,246)','rgb(255,193,134)']
},
fileTypeChartOption:{
title : {
text: '类型统计',
subtext: '',
x:'left',
textStyle:{
color:"#222",
fontStyle:"normal",
fontWeight:"600",
fontFamily:"san-serif",
fontSize:16,
}
},
tooltip : {
trigger: 'item',
formatter: "{a} {b} : ({c}门) {d}%"
},
legend: {
x : '70%',
y : '25%',
orient: 'vertical',
left: 'left',
itemWidth:10,
itemHeight:10,
selectedMode:false, //禁止点击
textStyle: {
fontSize: 12 ,
color:"#999",
},
formatter: function (name) {
return name.length > 4 ? (name.slice(0,4)+"...") : name
},
data: []
},
series : [
{
name: '',
type: 'pie',
radius : '75%',
center: ['50%', '54%'],
hoverAnimation:false, //是否开启 hover 在扇区上的放大动画效果
selectedMode:'single', //选中模式,表示是否支持多个选中,默认关闭,支持布尔值和字符串,字符串取值可选'single','multiple',分别表示单选还是多选。
selectedOffset:5, //选中扇区的偏移距离
data:[],
itemStyle: {
normal:{
label:{
show:true,
formatter: function(params){
var name=params.name; //名字
var percent=params.percent; //占比
var value=params.value; //数量
if(name.length>8){
return name.slice(0,7)+"..."+"\n"+"("+value+"门)"+percent+"%";
}else{
return name+"\n"+"("+value+"门)"+percent+"%";
}
}
},
labelLine:{
show:true
}
},
emphasis: {
shadowBlur: 10,
shadowOffsetX: 0,
shadowColor: 'rgba(0, 0, 0, 0.5)'
}
}
}
],
color: ['rgb(187,140,238)','rgb(134,146,243)','rgb(60,184,255)','rgb(113,171,246)','rgb(255,193,134)']
},
api: {
queryCoursePieChart: global_set.hostRe + '/course/queryCoursePieChart', //图表信息
},
echartBtn:true,
echartOn:true,
echartNum:1,
}
},
mounted: function() {
this.queryCoursePieChart();
},
methods: {
queryCoursePieChart:function(){
this.$http.get(
this.api.queryCoursePieChart, {
params:{
access_token:localStorage.token
}
}, {
emulateJSON: true
}
).then(function(data) {
if(data.body.code == 801) {
localStorage.token = null
this.$router.push({
path: '/index-auth-login',
query: {
'redirect': this.$route.query.fullPath
}
})
return false;
}
/*****************部门统计****************/
this.departmentOption.series[0].data=data.body.data.courseCountUsers1.list;
this.departmentOption.legend.data=data.body.data.courseCountUsers1.names.split(',');
/*****************岗位统计****************/
this.postChartOption.series[0].data=data.body.data.courseCountUsers2.list;
this.postChartOption.legend.data=data.body.data.courseCountUsers2.names.split(',');
/*****************人员统计****************/
this.personnelChartOption.series[0].data=data.body.data.courseCountUsers3.list;
this.personnelChartOption.legend.data=data.body.data.courseCountUsers3.names.split(',');
/*****************课程分类****************/
this.classifyChartOption.series[0].data=data.body.data.courseCountUsers4.list;
this.classifyChartOption.legend.data=data.body.data.courseCountUsers4.names.split(',');
/*****************文件类型****************/
this.fileTypeChartOption.series[0].data=data.body.data.courseCountUsers5.list;
this.fileTypeChartOption.legend.data=data.body.data.courseCountUsers5.names.split(',');
//初始化
this.drawLine();
}, function(err) {
this.$message.error('网络通讯错误')
});
},
drawLine:function(){// 初始化echarts实例
//获取demo元素
let departmentChart = echarts.init(document.getElementById('departmentChart'));
let postChart = echarts.init(document.getElementById('postChart'));
let personnelChart = echarts.init(document.getElementById('personnelChart'));
let classifyChart = echarts.init(document.getElementById('classifyChart'));
let fileTypeChart = echarts.init(document.getElementById('fileTypeChart'));
//初始化echarts
departmentChart.setOption(this.departmentOption);
postChart.setOption(this.postChartOption);
personnelChart.setOption(this.personnelChartOption);
classifyChart.setOption(this.classifyChartOption);
fileTypeChart.setOption(this.fileTypeChartOption);
},
echartShow:function(){ //图表展示隐藏
let chartMain= document.getElementById("chart-main");
let strong=document.getElementById("strong");
if(this.echartOn){
this.echartBtn=false;
}else{
this.echartBtn=true;
}
//显示隐藏上下滑动效果
chartMain.style.height = this.echartOn? "0": "215px";
strong.style.color = this.echartOn? "#222": "#999";
this.echartOn=! this.echartOn;
},
echartIsShow:function(n){ //不同图表切换
this.echartNum=n;
},
},
}
五.最终效果

六.另外如果不使用按需加载要全局使用,方法如下:
echarts 也不能通过 Vue.use() 进行全局调用,通常是在需要使用图表的 .vue 文件中直接引入import echarts from 'echarts'
也可以在 main.js 中引入,然后修改原型链Vue.prototype.$echarts = echarts
然后就可以全局使用let myEcharts = this.$echarts.init(document.getElementById('myEcharts'))
备注:我这块整个显示的宽度是固定的,所有没做适应容器处理,如果有需要可以自己加。这个饼状图组件内部详细配置借鉴于https://blog..net/luanpeng825485697/article/details/76738751

魔乐社区(Modelers.cn) 是一个中立、公益的人工智能社区,提供人工智能工具、模型、数据的托管、展示与应用协同服务,为人工智能开发及爱好者搭建开放的学习交流平台。社区通过理事会方式运作,由全产业链共同建设、共同运营、共同享有,推动国产AI生态繁荣发展。
更多推荐


 0
0 0
0- 0


 已为社区贡献2条内容

所有评论(0)