

zabbix监控kafka
介绍 (Introduction)
Apache Kafka is modern, powerful and fancy service provides storing and managing messages for real-time data processing.
Apache Kafka是一种现代,功能强大且新颖的服务,可提供存储和管理消息以进行实时数据处理。
Unfortunately, Apache Kafka has no monitoring tools by default but sometimes when Kafka has issues we should define and fix issues asap to prevent interruptions, loosing data and make sure that our services work properly.
不幸的是,Apache Kafka默认情况下没有监视工具,但是有时在Kafka出现问题时,我们应该尽快定义和修复问题,以防止中断,丢失数据并确保我们的服务正常运行。
Topic explains the easiest way how to monitoring Kafka using official Zabbix open-source monitoring system plugin that includes collecting JMX metric, alerting and monitoring consumers as well.
主题介绍了如何使用官方的Zabbix开源监视系统插件监视Kafka的最简单方法,该插件包括收集JMX指标,警告和监视使用者。
卡夫卡概述 (Kafka overview)
Publish-subscribe durable messaging system
发布-订阅持久消息系统
A messaging system sends messages between processes, applications, and servers. Apache Kafka is a software where topics can be defined (think of a topic as a category), applications can add, process and reprocess records.
消息传递系统在进程,应用程序和服务器之间发送消息。 Apache Kafka是一种软件,可以在其中定义主题(将主题视为类别),应用程序可以添加,处理和重新处理记录。
Applications connect to this system and transfer a record onto the topic. A record can include any kind of information; for example, information about an event that has happened on a website, or an event that is supposed to trigger an event. Another application may connect to the system and process or re-process records from a topic. The data sent is stored until a specified retention period has passed by.
应用程序连接到该系统并将记录转移到该主题上。 记录可以包含任何种类的信息; 例如,有关网站上发生的事件或应该触发事件的事件的信息。 另一个应用程序可以连接到系统并处理或重新处理主题中的记录。 发送的数据将被存储,直到经过了指定的保留期限。
Main parts in a Kafka system
Kafka系统的主要部件
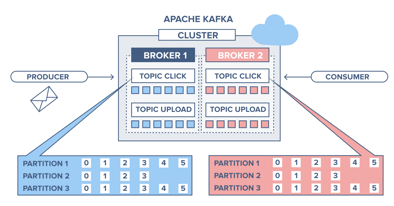
Broker: Handles all requests from clients (produce, consume, and metadata) and keeps data replicated within the cluster. There can be one or more brokers in a cluster.
代理:处理来自客户端的所有请求(生产,使用和元数据),并将数据复制到集群中。 集群中可以有一个或多个代理。
Zookeeper: Keeps the state of the cluster (brokers, topics, users).
Zookeeper:保持群集的状态(经纪人,主题,用户)。
Producer: Sends records to a broker.
生产者:将记录发送给经纪人。
Consumer: Consumes batches of records from the broker.
使用者:从经纪人那里消费一批记录。
Zabbix概述 (Zabbix overview)
Zabbix is an open-source monitoring software tool for diverse IT components, including networks, servers, virtual machines (VMs) and cloud services.
Zabbix是用于各种IT组件(包括网络,服务器,虚拟机(VM)和云服务)的开源监视软件工具。

Zabbix provides monitoring metrics, among others network utilization, CPU load and disk space consumption.
Zabbix提供了监控指标,其中包括网络利用率,CPU负载和磁盘空间消耗。
Zabbix monitoring configuration can be done using XML based templates which contain elements to monitor.
Zabbix监视配置可以使用基于XML的模板完成,该模板包含要监视的元素。
The software monitors operations on Linux, Hewlett Packard Unix (HP-UX), Mac OS X, Solaris and other operating systems (OSes); however, Windows monitoring is only possible through agents.
该软件监视Linux,Hewlett Packard Unix(HP-UX),Mac OS X,Solaris和其他操作系统(OSes)上的操作; 但是,只能通过代理监视Windows。
Zabbix includes support for monitoring via SNMP, TCP and ICMP checks, as well as over IPMI, JMX, SSH, Telnet and using custom parameters.
Zabbix支持通过SNMP,TCP和ICMP检查以及IPMI,JMX,SSH,Telnet和使用自定义参数进行监视。
Kafka群集的潜在问题 (Potential issues with Kafka Clusters)
Hardware issues:
硬件问题:
Slow disks write/read — Kafka produces high load on the disks during getting data/messages from produces. Slow network capacity/delays — During replication of the data between brokers it uses network and some times need to tune networks as well on the OS layer.
磁盘写入/读取速度慢 -从生产中获取数据/消息期间,Kafka在磁盘上产生高负载。 慢的网络容量/延迟 -在代理之间复制数据期间,它使用网络,有时还需要在OS层上调整网络。
Kafka services not configured/tuned:
未配置/调整的Kafka服务:
Configurations file of the service has a lot of the properties that after add correct values give possibilities to increase performance entire the cluster without update hardware or networking.
服务的配置文件具有许多属性,这些属性添加正确的值后,就可以在不更新硬件或网络的情况下提高整个群集的性能。
Topics configurations:
主题配置:
Replications factors — defines the number of copies of a topic in a Kafka cluster. Replication factor can be defined at topic level. Replicas are distributed evenly among Kafka brokers in a cluster.
复制因子 -定义Kafka集群中主题的副本数。 可以在主题级别定义复制因子。 副本在群集中的Kafka代理之间平均分配。
Number of partitions — choosing the proper number of partitions for a topic is the key to achieving a high degree of parallelism with respect to writes to and reads and to distribute load.
分区数 -为主题选择适当的分区数是在读写和分配负载方面实现高度并行性的关键。
delete.retention.ms — this setting also gives a bound on the time in which a consumer must complete a read if they begin from offset 0 to ensure that they get a valid snapshot of the final stage (otherwise delete tombstones may be collected before they complete their scan).
delete.retention.ms —此设置还限制了使用者从偏移量0开始的读取必须完成的时间,以确保他们获得最后阶段的有效快照(否则,删除墓碑可能会在它们之前被收集完成扫描)。
cleanup.policy — a string that is either “delete” or “compact” or both. This string designates the retention policy to use on old log segments. The default policy (“delete”) will discard old segments when their retention time or size limit has been reached.
清理策略 - 一个 “删除”或“紧凑”或两者兼有的字符串。 此字符串指定要在旧日志段上使用的保留策略。 当达到旧段的保留时间或大小限制时,默认策略(“删除”)将丢弃旧段。
compression.type — specify the final compression type for a given topic. This configuration accepts the standard compression codecs (‘gzip’, ‘snappy’, ‘lz4’, ‘zstd’). It additionally accepts ‘uncompressed’ which is equivalent to no compression; and ‘producer’ which means retain the original compression codec set by the producer.
compression.type —指定给定主题的最终压缩类型。 此配置接受标准压缩编解码器(“ gzip”,“ snappy”,“ lz4”,“ zstd”)。 此外,它接受“未压缩”,等同于不压缩。 “生产者”表示保留由生产者设置的原始压缩编解码器。
etc.
等等
Consumers:
消费者:
number of consumers — applications that need to read data from Kafka use a KafkaConsumer to subscribe to Kafka topics and receive messages from these topics. consumers are typically grouped by their shared function in a system into Consumer Groups. While Kafka allows only one consumer per topic partition, there may be multiple consumer groups reading from the same partition.
大量用户 —需要从Kafka读取数据的应用程序使用KafkaConsumer订阅Kafka主题并接收来自这些主题的消息。 消费者通常按其在系统中的共享功能分组为消费者组。 尽管Kafka的每个主题分区仅允许一个使用者 ,但可能有多个使用者组从同一分区读取。
卡夫卡监控 (Kafka monitoring)
Monitoring hardware
监控硬件
Zabbix provides Template for monitoring OS by default with metrics:
Zabbix提供了默认情况下用于监视操作系统的模板,其中包含指标:
— CPU— Memory— Disks (auto discovering)— Network (auto discovering)— etc.
— CPU—内存—磁盘(自动发现)—网络(自动发现)等
Zabbix Template covers all needs for the monitoring hardware of the Kafka Brokers without additional custom scripts. It has alerting as well. Alerts could be send to the Slack, Email, PagerDuty and etc.
Zabbix模板涵盖了Kafka Brokers监控硬件的所有需求,而无需其他自定义脚本。 它也有警报。 警报可以发送到Slack,Email,PagerDuty等。
Kafka monitoring
卡夫卡监控
Zabbix has possibilities to collect and evaluate JMX metrics.According to the official Kafka monitoring we collects required metrics
Zabbix可以收集和评估JMX指标。根据官方的Kafka监控,我们收集了所需的指标
Here is architecture schema of the collecting JMX metrics :
这是收集JMX指标的体系结构架构:

Kafka monitoring Brokers and Topics
Kafka监控经纪人和主题
Kafka uses Yammer Metrics for metrics reporting in the server.
Kafka使用Yammer Metrics在服务器中报告指标。
The Java clients use Kafka Metrics, a built-in metrics registry that minimizes transitive dependencies pulled into client applications.
Java客户端使用Kafka Metrics,它是一个内置的度量标准注册表,可最大程度地减少拉入客户端应用程序的可传递依赖项。
Both expose metrics via JMX and can be configured to report stats using pluggable stats reporters to hook up to your monitoring system.
两者都通过JMX公开指标,并且可以配置为使用可插拔的统计报告器报告统计信息,以连接到您的监视系统。
All Kafka rate metrics have a corresponding cumulative count metric with suffix -total.
所有Kafka速率指标都有一个后缀为-total的相应累积计数指标。
For example, records-consumed-rate has a corresponding metric named records-consumed-total. The easiest way to see the available metrics is to fire up jconsole and point it at a running kafka client or server; this will allow browsing all metrics with JMX.
例如,recordsconsumed-rate有一个对应的指标,称为records-consumed-total。 查看可用指标的最简单方法是启动jconsole并将其指向正在运行的kafka客户端或服务器。 这将允许使用JMX浏览所有指标。
Kafka monitoring Consumers
卡夫卡监测消费者
Burrow is a monitoring companion for Apache Kafka that provides consumer lag checking as a service without the need for specifying thresholds.
Burrow是Apache Kafka的监视伴侣,它无需指定阈值即可将消费者滞后检查作为服务提供。
It monitors committed offsets for all consumers and calculates the status of those consumers on demand.
它监视所有消费者的承诺抵销,并根据需要计算这些消费者的状态。
An HTTP endpoint is provided to request status on demand, as well as provide other Kafka cluster information. There are also configurable notifiers that can send status out via email or HTTP calls to another service.
提供HTTP端点以按需请求状态,并提供其他Kafka群集信息。 还有一些可配置的通知程序,可以通过电子邮件或HTTP调用向其他服务发送状态。
Here is architecture schema of the collecting consumers status:
这是收集使用者状态的体系结构架构:

例子 (Examples)
解决方案经过测试: (Solution tested on:)
Zabbix 4.4+Kafka 2.x+BurrowCMAK (Kafka manager)
Zabbix 4.4 + Kafka 2.x + BurrowCMAK(Kafka经理)
Hardware monitoring:
硬件监控:


Monitoring Brokers:
监控经纪人:
Zabbix plugin collects JMX metrics recommended by Apache Kafka
Zabbix插件收集Apache Kafka推荐的JMX指标

Monitoring topics:
监控主题:

Monitoring consumers by Zabbix:
通过Zabbix监视消费者:
Monitoring consumer lag very important to see when need to increase number of consumers for processing messages/data more efficiently
监视使用者延迟非常重要,以查看何时需要增加使用者数量以更有效地处理消息/数据


摘要: (Summary:)
Kafka monitoring plugin is official Zabbix plugin which supports advanced monitoring of the Apache Kafka. It supports metrics collecting as well as alerting when cluster has issues. The template is easy to install and configure according to the business needs.
Kafka监视插件是官方的Zabbix插件,它支持对Apache Kafka的高级监视。 它支持指标收集以及在群集出现问题时发出警报。 该模板易于根据业务需求进行安装和配置。
For the future improvements it could be advanced partitions monitoring but it depends on the cluster size and Zabbix server performance.
对于将来的改进,它可以是高级分区监视,但它取决于集群大小和Zabbix服务器性能。
网址: (URLs:)
https://github.com/helli0n/kafka-monitoringhttps://kafka.apache.org/https://kafka.apache.org/documentation/#monitoringhttps://www.zabbix.com/server_monitoringhttps://www.zabbix.com/ru/integrations/kafkahttps://github.com/linkedin/Burrowhttps://github.com/yahoo/CMAK
https://github.com/helli0n/kafka-monitoring https://kafka.apache.org/ https://kafka.apache.org/documentation/#monitoring https://www.zabbix.com/server_monitoring https: //www.zabbix.com/ru/integrations/kafka https://github.com/linkedin/Burrow https://github.com/yahoo/CMAK
翻译自: https://medium.com/devoops-and-universe/kafka-monitoring-by-zabbix-bde7693bb86c
zabbix监控kafka




 已为社区贡献4条内容

所有评论(0)